Analyzing Year-to-Date Performance in Tableau: Techniques and Methods
Comparing Current Year vs. Previous Year in Tableau: Insightful Analysis Approaches
Maximizing Data Insights: Effective Methods for Year-to-Date Comparison in Tableau
Metrics on a Tableau Dashboard play a major role in reporting – especially when comparing values across time, with the most common being Year over Year growth.
Today, most C-level suite or VP/Managerial workforce are looking for answers to questions like:
a) How did we perform this year compared to the last year?
b) How much have we grown as a business from when we started the venture?
c) Where do we stand against our own values with respect to the previous quarter or previous month or previous week?
These questions ultimately lead to the most important questions i.e.
d) What is driving this growth change?
e) Why is this factor causing a decrease?
f) What should we focus on to improve and propel in the forward direction?
Some common examples are:
- Police Departments introduce stricter measures every year to see decrease in crime rates, be it speeding tickets, petty crimes, theft etc.
- Air travel companies look for increase in passenger traffic thus driving the revenue
- Department of Homeland Security strives every year to reduce the number of illegal immigration cases
- Retail markets look for improvement in customer loyalty and product quality
- Department of Education tries to improve the education system by encouraging more children to be educated thus hiring more teachers and providing better infrastructure.
The list goes on as long as there is data.
In this blog, we will be comparing values from this year Vs. those from last year until today (including today). In essence what we are trying to do is simply evaluate the YTD (Year to Date) for the CY (Current Year) Vs. the PY (Previous Year) – note, there are different methods to do this and we will be discussing two type of calculations.
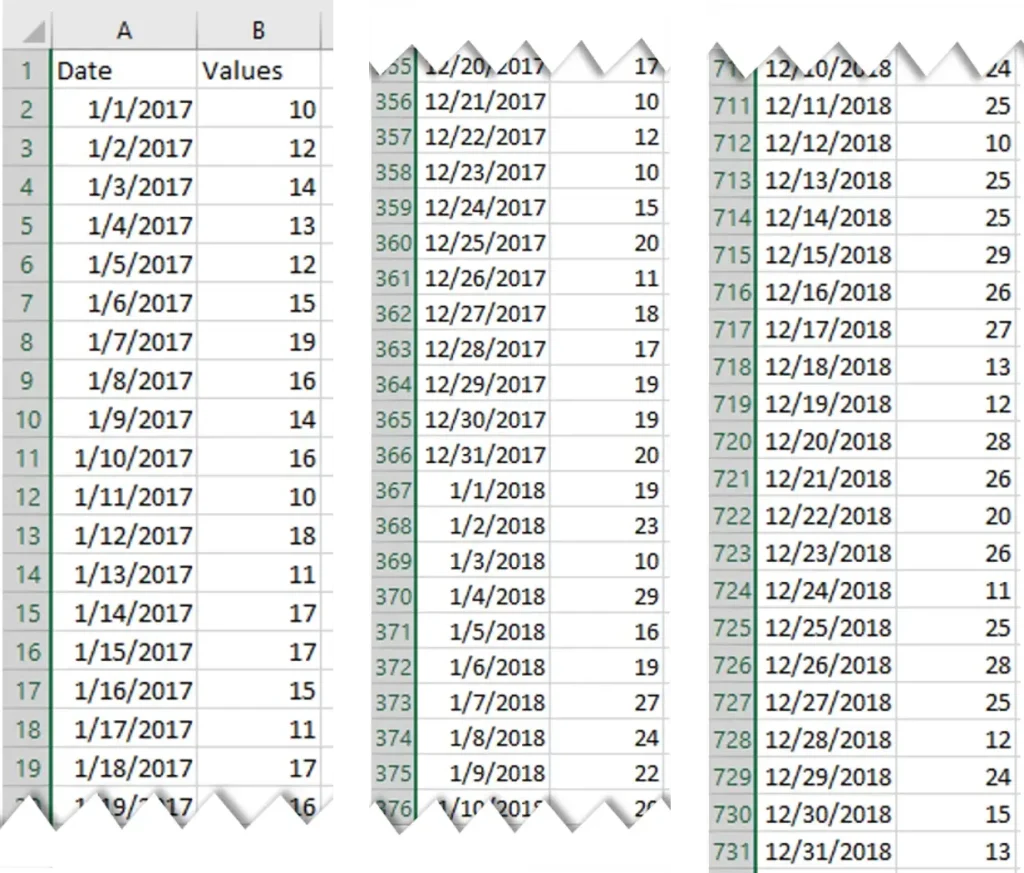
We will be considering a sample data file for this example that is created for all days from Jan-1-2017 to Dec-31-2018 with some random values.
Note: This blog was written on April-15-2018. So, all values will be calculated for the same date – with all value after this date not being used / considered.
Understanding Year-to-Date (YTD) Analysis in Tableau
Exploring Two Methods for Year-to-Date (YTD) Current Year vs. Previous Year (CY vs. PY) Comparison
Method 1: Calculated Fields for Year-to-Date (YTD) Comparison in Tableau
Method 2: Leveraging Tableau’s Date Functions for Year-to-Date (YTD) Analysis
Analytical Powerhouse: Harnessing Tableau for Year-to-Date (YTD) Performance Comparison
Unveiling Insights: Strategies for Effective Year-to-Date (YTD) Current Year vs. Previous Year (CY vs. PY) Analysis
Advanced Data Techniques: Optimizing Tableau for Year-to-Date (YTD) Comparative Analysis
Enhancing Decision-Making: Leveraging Year-to-Date (YTD) Analysis in Tableau for Actionable Insights
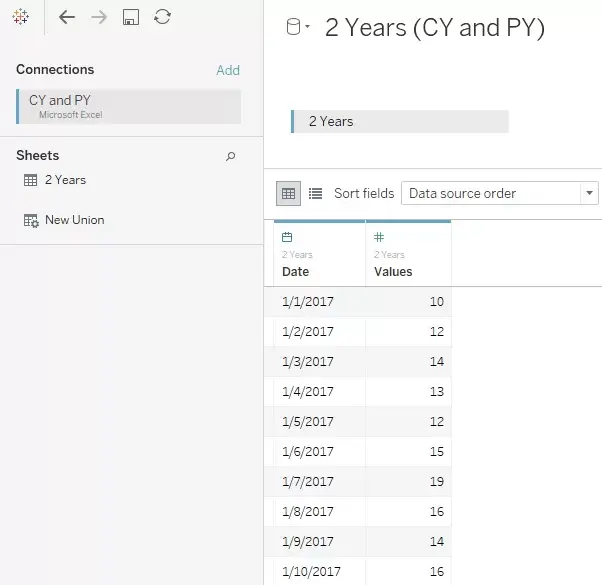
We will further require various calculations to execute this. All calculations can be combined into one, and for the sake of simplicity and ease of understanding, we will break it into pieces.
Method 1 – Creating YTD (Year to Date) for the CY (Current Year) vs the PY (Previous Year) in Tableau
1) First, we need the Current Date i.e. Today’s Date. Tableau has a ready function called Today (). It will pick the system date. We can make it a Date-Time field if required.



2) Next, we need all values till today (including today) for this year alone. For this, we will be using a conditional comparison statement with a DateDiff() function.
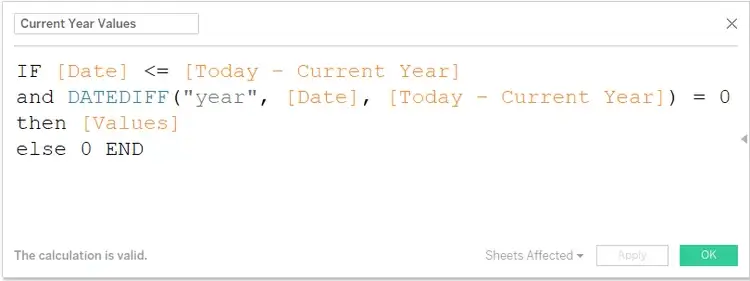
In this case, both are row level calculations.
- The first part of the calculation: Date <= Today is selecting every Date that is less than today and equal to today.
- The second part of the calculation: Datediff(“year”, Date, Today) = 0 is selecting only dates from this year.
- For example, Mar-30-2018, when we subtract 2018 from this date with today (April-15-2018) the value will be 0.
- Anything from 2017 will result in 1 which will be eliminated.
- The AND operator will check both parts of the calculation in series i.e. both features must be TRUE and then we obtain the corresponding Values.
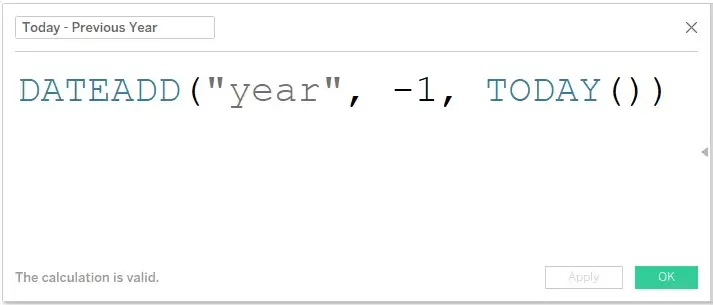
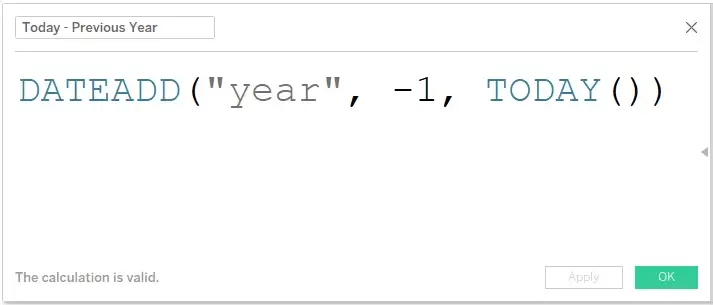
3) We need to repeat the same for the Previous Year. The DateAdd() function can be used for Integer addition and subtraction for the specified date part. This calculation will go exactly 1 year back that is the reason to use 1 with a negative value. In some situations, the leap year is taken into account.

4) Next, we will find values only for 2017.
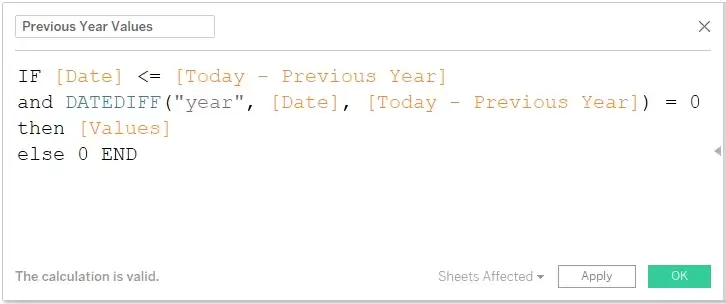
For example, Mar-30-2017, when we subtract 2017 from this date (April-15-2017) the value will be 0. Everything before 2017 if any and anything from 2018 will be eliminated.
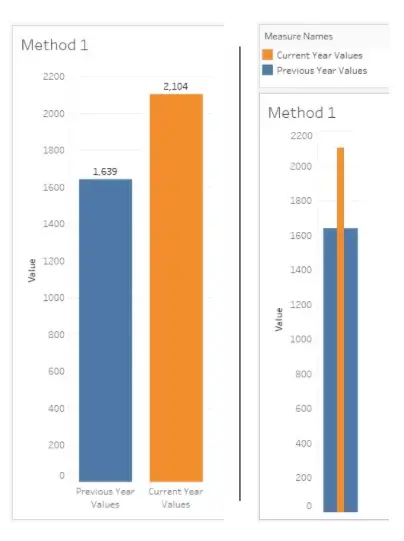
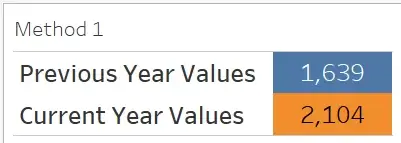
5) The last step would be to show both values together. Either as Side by Side Bar chart or Bar in Bar chart or a Bullet chart to show progress or just a simple Text table.
Method 2 – Creating YTD (Year to Date) for the CY (Current Year) vs the PY (Previous Year) in Tableau
Though this method has a couple of extra steps, it is easier to relate to and understand.
Note: The starting steps are same as the previous method.
1) Create calculations for Today – Current Year and Today – Previous Year

2) Next, we will find the first day of each year in two new calculations.
- The DateTrunc() function will Roll-Up to the first Calendar entry (or Fiscal entry) of the specified Date Part.
- If it is Year, the value will be Jan 1. If it is Quarter, the value will be Jan 1, Apr 1, Jul 1 and Oct 1.
- If it is month, the value will be Jan 1, Feb 1, Mar 1, ……. Dec 1.


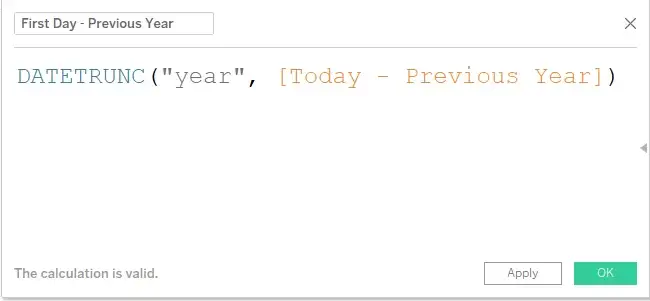

3) Next, we need to find values within the required dates – we can either write a DateDiff() calculation or create a simple conditional calculation. It is very straightforward approach.
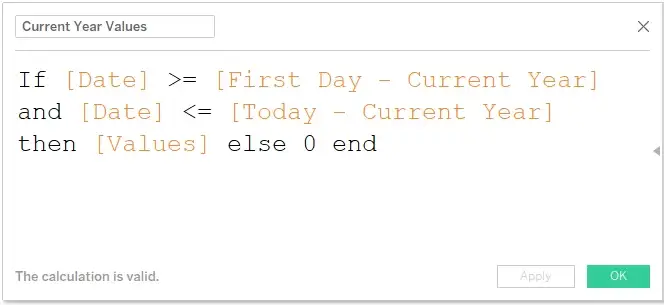
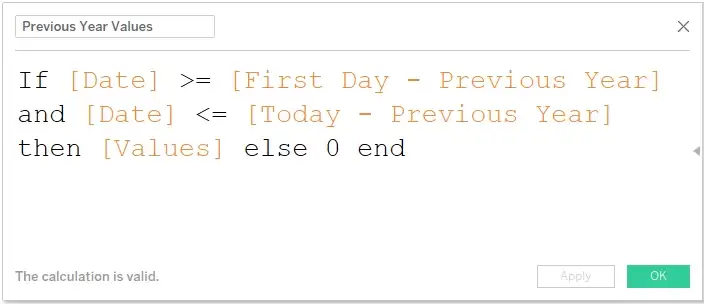
4) The Last step is to show the values together.
We can see that both Method 1 and Method 2 yield the same results.


 Media Coverage
 Press Release
