


 Media Coverage
 Press Release
Leveraging Dynamic Filters for Advanced Analytics in Power BI
Create Interactive Dashboards with Top N Trends
Uncover Key Insights with Dynamic Filtering in Power BI
Understanding Top N Analysis in Power BI
Step-by-Step Guide to Implementing Dynamic Filters
Benefits of Visualizing Trends Over Time
Best Practices for Power BI Dashboards
Setting Up Dynamic Filters for Top N Analysis
Optimizing Trend Visualizations in Power BI
Creating Interactive Reports with Time-Based Data
Troubleshooting Dynamic Filtering Issues
When working with large datasets, visualizing the top-performing categories or states over time is essential for insightful analysis. In Power BI, you can achieve this by creating a dynamic trend line graph that focuses on the Top N values based on specific measures like Profit or Sales. In this blog, we will walk you through how to do just that.
The Objective
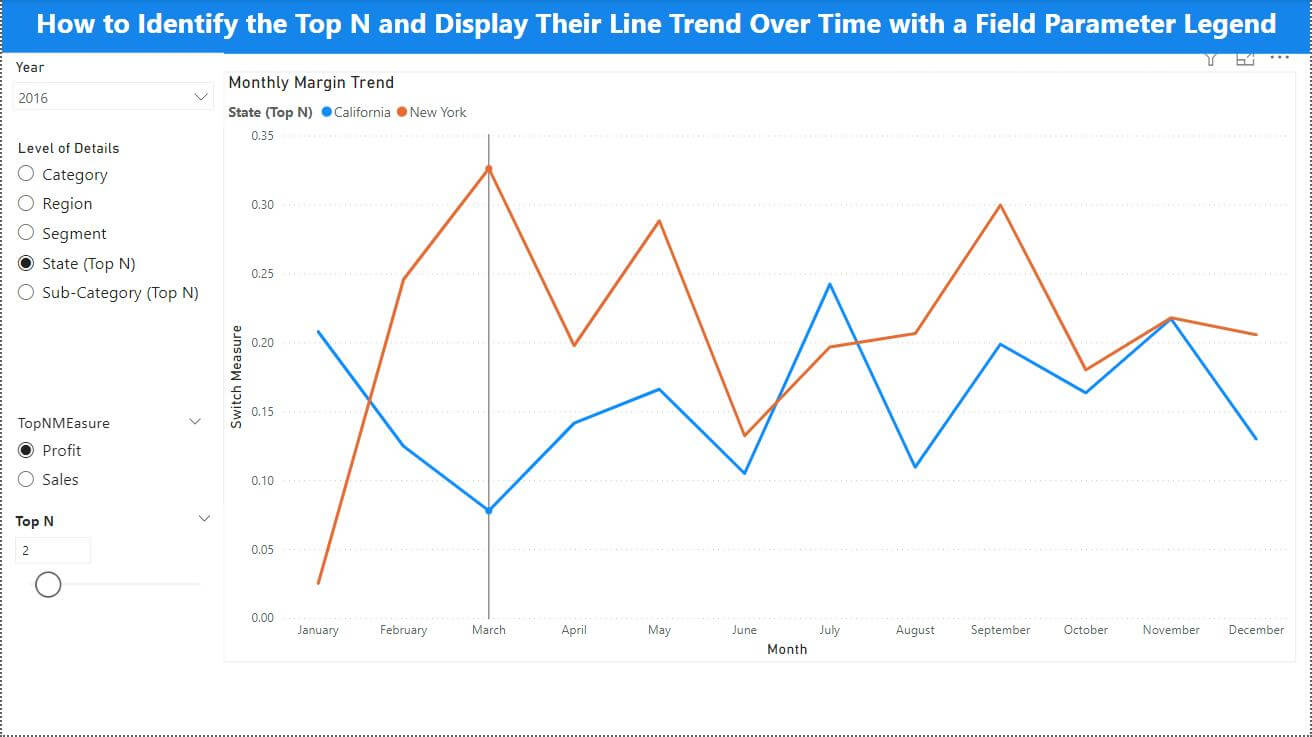
Imagine a dataset of monthly sales margins, and you want to create a trend line graph showing the margin percentage. To avoid overwhelming users, the graph will focus on the Top N records, dynamically filtered by measures such as Profit or Sales. This will provide a clear visual of the top-performing categories or states over the entire time period.
The Challenge
In this situation, the initial approach displayed the Top N results for each month individually. While this worked to some extent, it led to an inaccurate portrayal of the trend, as the top performers were changing month by month rather than being consistent across the entire time period. The goal was to show the top performers for the full period and track their trend.
The Solution
Let’s break down the solution step-by-step, turning technical requirements into an intuitive process.
Step 1
Creating a Field Parameter for Dimensions
The first step is setting up a field parameter with the necessary dimensions, like Category, Region, Segment, State, and Sub-Category. This enables the user to select which dimension they want to visualize in the trend graph.
Step 2
Adding a Dynamic Top N Selector
Next, a numeric parameter is created to allow users to control the number of top values they want to see on the graph. For example, a user can select to view the Top 5 or Top 10 performers over time.
Step 3
Introducing a Measure Selector
To make the visualization even more powerful, a second field parameter is created to allow switching between measures – Profit or Sales. This way, users can choose whether they want to see the top performers based on Profit or Sales for a clearer business insight.
Step 4
Writing the DAX Logic for Dynamic Filtering
Now, by using the TOPN function in combination with other variables, you can dynamically calculate the Top N performers. The logic pulls the top N values either by state or sub-category, depending on what the user selects. The dynamic nature of the filtering ensures that the Top N values are consistent over the full-time range, allowing for a smooth, accurate trend line.
Step 5
Plotting the Line Graph
Once the DAX logic is in place, you can proceed to plot the graph. The X-axis is set to display the order dates (by month), and the Y-axis shows the switchable measure (either Profit or Sales). The legend dynamically adjusts based on the field parameter selection, and the slicers allow users to further filter the data by year or other fields.
Final Thoughts
With this setup, you can easily visualize the top-performing categories or states over time, enabling stakeholders to identify trends and make data-driven decisions. This dynamic approach enhances the clarity and impact of your analysis, making it a must-have in your Power BI toolbox!
By creating this user-friendly and interactive visualization, Power BI users can explore data in more depth, identifying key trends that might have otherwise been missed in a sea of data.
Here are the detailed steps (Dax included).
Step 1
1. Create a Field parameter with the dimensions required (Category, Region, Segment, State, Sub- Category)
Level of Detail = {
    ("Segment", NAMEOF('Orders'[Segment]), 0),
    ("Category", NAMEOF('Orders'[Category]), 1),
    ("Sub-Category (Top N)", NAMEOF('Orders'[Sub-Category]), 2),
    ("Region", NAMEOF('Orders'[Region]), 3),
    ("State (Top N)", NAMEOF('Orders'[State]), 4)
}
2. Creating a calculated column in the same field parameter table
LOD = 'Level of Detail'[Level of Detail]This column is used in the slicer to display and fetch the currently selected value
Step 2
Creating a Top N – Numeric Parameter with range according to your record count
Top N Products = GENERATESERIES(0, 20, 1)Step 3
1. Create a Field parameter “Top N Measure“ with the measures required (Profit and Sales)
Top N Measure = {
    ("Profit", NAMEOF('Orders'[Profit Calc]), 0),
    ("Sales", NAMEOF('Orders'[Sales Calc]), 1)
}
2. Creating a calculated column in the same field parameter table
TopNMEasure = 'Top N Measure'[Top N Measure]This column is used in the slicer to display and fetch the currently selected value
Step 4
1. Create a calculated measure named “Switch Measure” to implement the required logic.
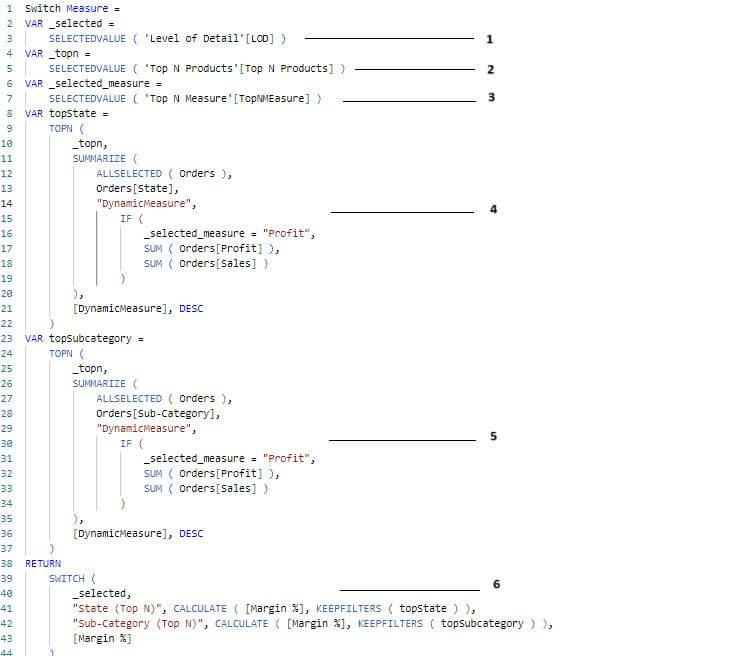
Here, we are using five variables to implement the logic.
1. VAR _selected = SELECTEDVALUE('Level of Detail'[LOD])This variable fetches the currently selected value from the “Level of Detail” field parameter
2. VAR _topn = SELECTEDVALUE('Top N Products'[Top N Products])This variable fetches the current selected value from the “Top N Products” field parameter
3. VAR _selected_measure = SELECTEDVALUE('Top N Measure'[TopNMEasure])This variable fetches the current selected value from the “Top N Measure” field parameter
4. VAR topState =
    TOPN (
        _topn,
        SUMMARIZE (
            ALLSELECTED ( Orders ),
            Orders[State],
            "DynamicMeasure",
                IF (
                    _selected_measure = "Profit",
                    SUM ( Orders[Profit] ),
                    SUM ( Orders[Sales] )
                )
        ),
        [DynamicMeasure], DESC
)
The provided DAX expression uses the TOPN function to dynamically calculate the “Top N” values based on a selected measure (either “Profit” or “Sales”) for a specific dimension, which in this case is the “Sub-Category” from the Orders table.
Let’s break down each component of the expression.
DAX Expression Breakdown
a. TOPN Function:
- TOPN returns the top N rows of a table based on the specified criteria. Here, the number of rows to return (N) is controlled by the _topn variable.
b. ALLSELECTED (Orders):
- The ALLSELECTED function removes filters from the Orders table except those set by the user, such as slicers or filters applied in the report. This ensures that the context of the selection remains, and we are working with the selected subset of the data, not the entire table.
c. SUMMARIZE Function:
- SUMMARIZE is used to create a summary table for the specified group of columns, which in this case is Orders[Sub-Category].
- Inside SUMMARIZE, a new column called “DynamicMeasure” is defined, which dynamically calculates either SUM(Orders[Profit]) or SUM(Orders[Sales]) based on the _selected_measure parameter.
d. IF Function:
- The IF function checks the value of _selected_measure:
- If _selected_measure is “Profit”, it calculates the total profit using SUM(Orders[Profit]).
- Otherwise, it calculates the total sales using SUM(Orders[Sales]).
e. [DynamicMeasure]:
- [DynamicMeasure] is the dynamically created column inside SUMMARIZE that stores the calculated value of either “Profit” or “Sales”.
- This column is then used as the sort order for the TOPN function.
f. DESC:
- The DESC keyword specifies that the sorting should be in descending order, so the highest values (top N) will be returned.
5. VAR topSubcategory =
    TOPN (
        _topn,
        SUMMARIZE (
            ALLSELECTED ( Orders ),
            Orders[Sub-Category],
            "Sales",
                IF (
                    _selected_measure = "Profit",
                    SUM ( Orders[Profit] ),
                    SUM ( Orders[Sales] )
                )
        ),
        [Sales], DESC
    )
The DAX expression for the variable topSubcategory follows the same principle as the topState variable explained in step 4. The only difference is that [Sub-Category] is used to summarize the table instead of [State].
6. In the RETURN statement
SWITCH (
        _selected,
        "State (Top N)", CALCULATE ( [Margin %], KEEPFILTERS ( topState ) ),
        "Sub-Category (Top N)", CALCULATE ( [Margin %], KEEPFILTERS ( topSubcategory ) ),
        [Margin %]
)
In the provided DAX expression, we’re using a SWITCH function to dynamically compute the [Margin %] measure based on the user’s selection in a parameter called _selected. This parameter appears to control the “Level of Detail” for analysis, such as “State (Top N)” or “Sub-Category (Top N)”. Depending on what is selected, different calculations are applied using the CALCULATE function with KEEPFILTERS.
Here’s a breakdown of the expression:
SWITCH Statement
The SWITCH function checks the value of the _selected parameter. Depending on its value, different expressions are evaluated:
- If _selected is “State (Top N)”, it calculates [Margin %] while keeping the filters defined by the variable topState.
- If _selected is “Sub-Category (Top N)”, it calculates [Margin %] while keeping the filters defined by the variable topSubcategory.
- If neither “State (Top N)” nor “Sub-Category (Top N)” is selected, it simply returns [Margin %] without any additional filters.
CALCULATE Function
This function is used to modify the filter context for the calculation of [Margin %].
- CALCULATE is recalculating [Margin %] in the context defined by the filters.
- KEEPFILTERS is used within CALCULATE to ensure that any existing filters applied to topState or topSubcategory are maintained rather than replaced.
KEEPFILTERS
This function is critical when you want to preserve existing filters on a column rather than override them. In this context, it means that when calculating the [Margin %]:
- For “State (Top N)”, it keeps the filters defined by topState.
- For “Sub-Category (Top N)”, it keeps the filters defined by topSubcategory.
Step 5
Line Graph Plotting:
- X Axis: Order Date (Month)
- Y Axis: Switch Measure
- Legend: Level of Detail (LOD)
Slicers:
- Year: Dropdown for filtering by year period
- LOD: Single selection for choosing the graph level of detail
- TopNMeasure: Single selection for selecting the TOP N measure
- Top N Products: Single value with a slider
By setting up the graph with these details, you can visualize the Margin % trend over time and display the Top N legends effectively.

Thanks for reading!
