Mastering Parameter Actions: A Comprehensive Guide for Tableau Users
Enhancing Dashboard Interactivity: Using Parameter Actions to Filter in Tableau
Elevate Your Data Analysis: Leveraging Parameter Actions for Multiple Measures in Tableau Dashboards
“One of the greatest features of Tableau is that the end-user can interactively drill-down into their data to get to the nitty-gritty details if they desire.” This is probably something that you’ve heard (or read) before. I love being able to develop dashboards in Tableau that allow the end-user to interact directly with the visualizations to drill-down to the level of detail they need to answer questions. There are many ways to enable users in this way but depending on what visualizations you’ve created, you might run into some roadblocks.
Understanding Parameter Actions: Introduction to Interactive Filtering Techniques in Tableau
Step-by-Step Tutorial: How to Use Parameter Actions to Filter Multiple Measures in Tableau
Advanced Techniques: Optimizing Data Visualization with Parameter Actions in Tableau Dashboards
Tips and Tricks: Best Practices for Implementing Parameter Actions in Tableau for Enhanced Interactivity
For example, in one of my previous blogs, Using Sets to Filter in Tableau, I go over how to use Sets and Set Actions to allow an end-user to filter down to customer details when making a selection in either the Sub- or Grand Totals because Filter Actions won’t suffice. (If you have not done so already, I recommend reading this blog as it may help in understanding when it is necessary to use parameter actions to filter.)
After posting that blog, I actually had a meeting with a client who had a similar filtering issue. Thinking that sets would be the answer, I started to walk them through the solution I had previously documented, but there was one problem. Their visualization was made up of multiple measures. Knowing that you cannot use either Measure Names or Measure Values in a set or calculated field, I had to figure out another way to mimic the drill-down capability.
Setting Up Parameter Actions: Configuring Parameter Actions for Interactive Filtering in Tableau
Creating Interactive Filters: Defining Filter Options for Multiple Measures in Tableau Dashboards
Improving User Experience: Enhancing Dashboard Interactivity with Parameter Actions in Tableau
Maximizing Data Insight: Leveraging Parameter Actions to Drive Effective Data Analysis in Tableau
For the purpose of this blog, I have recreated the use-case with a mock dataset that includes details for individual loans. Feel free to download the dashboard (with solution implemented) here. In this use-case, I have a loan distribution analysis dashboard that shows loan distribution geographically, provides a summary sheet of loan count based on certain conditions, and loan details.
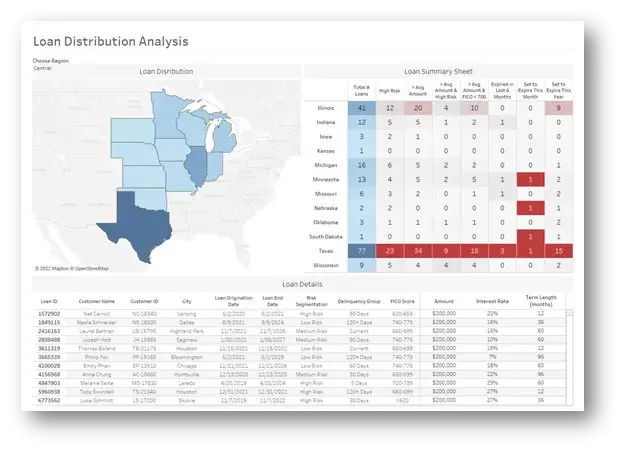
Normally, if I wanted to filter based on my selections in the visualizations, I could just enable filter actions from the Loan Distribution map and the Loan Summary Sheet highlight table. If I do that, I get the below result:
As you can see, filter actions work but only up to a point – in this example, only down to State level. It looks like I can’t select individual cells in the highlight table to filter down to the specific subset of loans I want.
Let’s take a look at that sheet and see why.
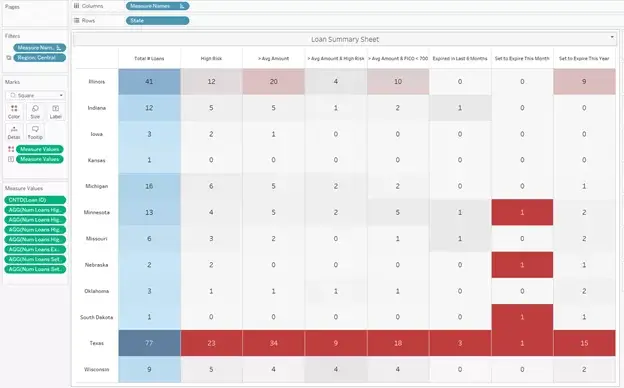
This sheet is developed as a highlight table that displays eight separate measures across the top. Because these are separate measures and not domain members of a dimension, Tableau does not understand how to filter when I select a certain cell/square.
To fix this, let’s go through some steps:
Step 1: Create a Parameter
I named mine “Chosen Measure” and gave it the following settings:
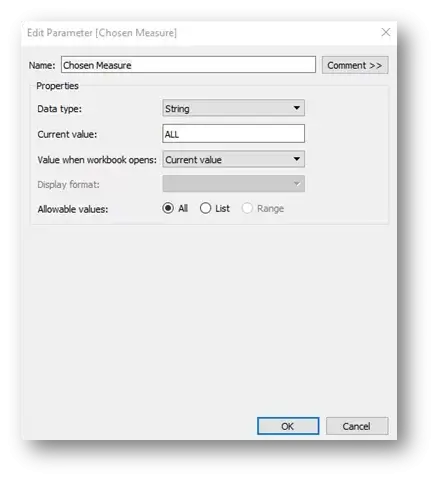
I am going to use this parameter to capture the selections or “clicks” from the Loan Summary Sheet worksheet.
Step 2: Create a Parameter Action
I know that you might be thinking “Why are we creating an action when we haven’t implemented any logic to filter our sheet yet?”. Call me crazy but I like to check my work as I develop. So, what I want to do here is make sure I understand how my Parameter Action is going to capture the different measure names as I make selections in my worksheet.
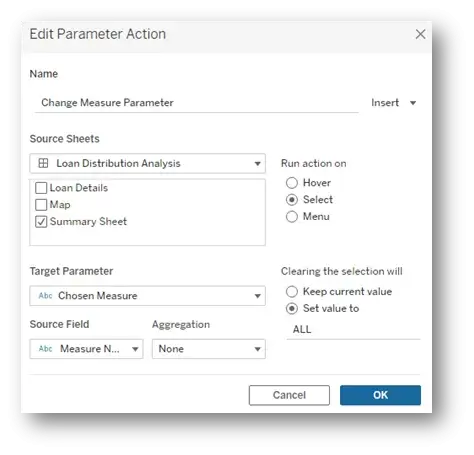
Add a Parameter Action with the following settings:

**Note that clearing the selection will set value to “ALL”.
This is important because when I clear my selection in the Loan Summary Sheet, I want to see all of my values in the Loan Details table. I will be implementing logic in an upcoming calculation to capture this.
To illustrate how I check my work, I have added a simple text object to a dashboard with my Loan Summary Sheet that will allow me to see what value my Chosen Measure parameter is taking after making selections in the sheet:
Knowing what values my Chosen Measure parameter is taking after making a selection will allow me to proceed to Step 3.
Step 3: Create a Calculated Field to Capture the Logic Needed to Filter
Right now, there is nothing directing Tableau to filter based on my selection. In order to do so, let’s create a new calculated field.
Chosen Measure Filter
CASE [Chosen Measure]

    WHEN "Total # Loans" THEN TRUE

    WHEN "Expired in Last 6 Months" THEN [Loan End Date]
        >= DATEADD('month',-5,DATETRUNC('month',TODAY())) AND [Loan End Date] < TODAY()

    WHEN "High Risk" THEN [Risk Segmentation] = "High Risk"

    WHEN "> Avg Amount" THEN [Amount] > [Avg Amount for State]

    WHEN "> Avg Amount & High Risk" THEN [Amount]
         > [Avg Amount for State] AND [Risk Segmentation] = "High Risk"

    WHEN "> Avg Amount & FICO < 700" THEN [Amount]
         > [Avg Amount for State] AND [FICO Score] IN ("<620", "620-659", "660-699")

    WHEN "Set to Expire This Month"
         THEN DATETRUNC('month',[Loan End Date])= DATETRUNC('month',TODAY())
         AND [Loan End Date] >= TODAY()

    WHEN "Set to Expire This Year" THEN
         DATETRUNC('year',[Loan End Date])= DATETRUNC('year',TODAY())
         AND [Loan End Date] >= TODAY()

    WHEN "ALL" THEN TRUE

END
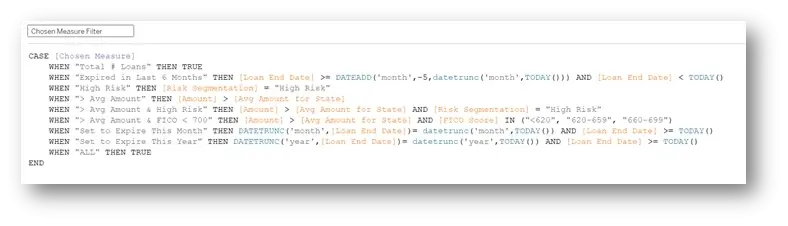
This calculated field is capturing the logic for each individual measure; combining this with a Filter Action to filter down to a selected state will allow us to drill-down to see a specific subset of loans. (You might be confused as to why “Total # Loans” results in a TRUE in the first line. This is by design. The Filter Action for state captures the logic needed for this to work properly.)
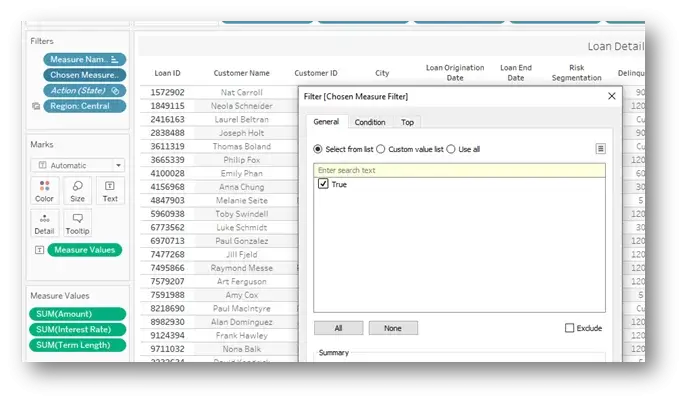
Now that the Chosen Measure Filter is created, make sure to place it on the Loan Details sheet filter shelf and select TRUE:
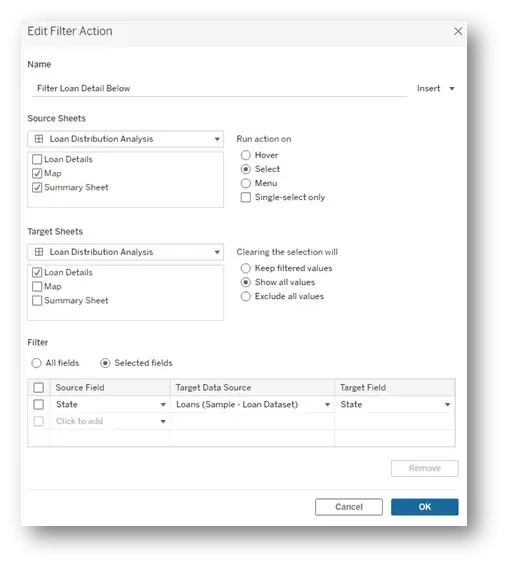
Step 4: Make Sure Dashboard Actions are set
There are three dashboard actions I will have for this dashboard. First, is the Filter Action:
Second, is the Parameter Action (same as earlier):
And third – solely to add to the functionality and look of the dashboard – a Highlight Action:
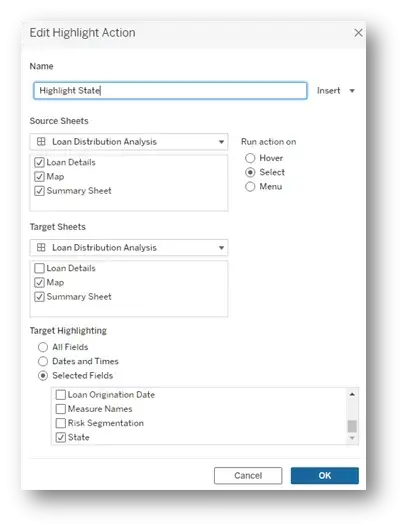
With all three dashboard actions implemented, I now have a fully functioning Tableau dashboard that allows me to get down to the detail I want.
Hopefully, if you have run into a situation like this before or are trying to fix a dashboard issue right now, you now can use this method to further enable your end-users and provide them the ability to drill-down based on a measure selection.