Comparing Multiple Chart Images
Enhance Data Visualization with GPT Vision
USEReady’s Guide to Advanced Visual Analysis
Comparing multiple images is a critical task in various fields, ranging from medical imaging to digital art. It involves analyzing two or more images to identify similarities, differences, patterns, or changes over time. This process can be performed manually, but it is more time-consuming and less efficient. With the advent of AI-powered tools like GPT Vision and Claude Vision, it has become more efficient and accurate.
In this blog, we will be looking at what chart analysis is and when is it required and more importantly how to do it with GPT-Vision.
Introduction to GPT Vision for Chart Comparison
Key Techniques for Visual Insights
Benefits of Using GPT Vision in Data Analysis
Practical Applications and Use Cases
Overview of Chart Image Comparison
Steps to Implement GPT Vision
Maximizing Analytical Capabilities with GPT Vision
Real-World Examples and Success Stories of GPT Vision
Comparing Multiple Images
Comparing multiple images is an essential practice across various industries and disciplines. In the field of Data Science and development, it is especially important as visual interfaces like dashboards, UIs, or any visual elements undergo a series of iterative development cycles depending on business use cases and are subject to changes over time. There is a need for close monitoring of these changes and tracking them regularly. Moreover, while transferring the local visual design to cloud servers, the data showcased locally might change depending on the procedures used or due to minor discrepancies during migration, which could lead to significant impacts in the future. This is where visual inspection becomes crucial, as one must carefully review each chart, graphical element, and other visual components to verify their accuracy in terms of both functionality and data correctness. Visual models like GPT-Vision and Claude-Vision come into play here, automating the manual labour and providing more reliable analysis within seconds.
The ability to analyze and interpret visual data accurately and efficiently has far-reaching implications, from improving product quality to advancing medical research. AI-powered tools like GPT-vision and Claude-vision have revolutionized this process offering enhanced capabilities and streamlined workflows. As we delve deeper into this topic, we will explore how these tools work and which one might be better suited for different applications. The implementation is not limited to image comparison only, but any kind of image analysis task one can think of. This blog focuses on the theme of image comparison task in case of chart or graphical images containing plots and relevant visualizations.
GPT Vision
GPT-4 Vision, also known as GPT-4V, is a huge leap in the advancement of AI by OpenAI. As opposed to its predecessor GPT-3, which was trained only for sequence to sequence or text to text task, GPT-4V was trained to be a multimodal model i.e., along with its previous understanding of natural language and related tasks, it also has vision capability integrated in it without compromising on the efficiency of the language tasks. This breakthrough broadens the possibilities for artificial intelligence by enabling multimodal LLMs to enhance language-based systems, create new interfaces, and address a more diverse set of tasks, ultimately delivering unique user experiences.
Now, along with generating code for developing user interfaces, one can even create an interface and send that image to GPT-4V for analysis and build on top of it. There are millions of such use cases which are being solved by GPT-4V, but this blog aims to discuss on a more specific task i.e. how to compare multiple images, especially dashboard images or any visual containing charts or graphs having relevant data and find the differences or get feedback from GPT-4V in the most efficient way as possible.
GPT-4V payload design for multiple images
To start developing the payload for multiple images, lets first look at what the official OpenAI docs say about it.
It says that:
- The Chat Completions API can process multiple image inputs.
- Inputs can be in base64 encoded format or as image URLs.
- The model processes each image but is not stateful i.e. for multiple API calls each image needs to be passed multiple times and the model doesn’t store any image for later use.
- The model uses information from all images to answer the question.
The question is, how to make the payload. The official documentation gives the below code for the same:
```python

from openai import OpenAI
client = OpenAI()
response = client.chat.completions.create(
  model="gpt-4o",
  messages=[
    {
      "role": "user",
      "content": [
        {
          "type": "text",
          "text": "What are in these images? Is there any difference between them?",
        },
        {
          "type": "image_url",
          "image_url": {
            "url": "https://upload.wikimedia.org/wikipedia/commons/thumb/d/dd/Gfp-wisconsin-madison-the-nature-boardwalk.jpg/2560px-Gfp-wisconsin-madison-the-nature-boardwalk.jpg",
          },
        },
        {
          "type": "image_url",
          "image_url": {
            "url": "https://upload.wikimedia.org/wikipedia/commons/thumb/d/dd/Gfp-wisconsin-madison-the-nature-boardwalk.jpg/2560px-Gfp-wisconsin-madison-the-nature-boardwalk.jpg",
          },
        },
      ],
    }
  ],
  max_tokens=300,
)
print(response.choices[0])
```
Let’s break it down:
- response:
This variable will store the response from the API call. - client.chat.completions.create:
This is a method to create a chat completion request using the client object. - model=”gpt-4o”:
Specifies the model to be used for the chat completion. In this case, it is “gpt-4o”. - messages=[…]:
This is a list of messages to be sent to the model.- Each message is a dictionary with the following keys:
- role: Specifies the role of the message sender. Here, it is “user”.
- content: This is a list of content items within the message.
- The first content item is a dictionary with:
- type: Specifies the type of content. Here, it is “text”.
- text: The actual text content. Here, it is “What’s in this image?”.
- The second content item is a dictionary with:
- type: Specifies the type of content. Here, it is “image_url”.
- image_url: This is a dictionary containing:
- url: The URL of the image to be processed.
- detail: Specifies the detail level of the image. Here, it is “high”.
- The first content item is a dictionary with:
- Each message is a dictionary with the following keys:
- max_tokens=300:
Specifies the maximum number of tokens (words or parts of words) to be generated in the response. Here, it is set to 300.
For the given payload above, we are just sending in two images and asking what is contained within them, but what if we want to know exactly which image contains something that we desire? We can’t pass any meta data directly here. In short, GPT can’t see any image name, image size or any details of that sort to distinguish one image from the other. If that is the case, then how can we cluster similar images together using GPT-4V?

That is where the payload design comes into play.
We would need to pass the image name in the payload or whatever we want to call or describe the image as, in the payload itself. How can we do it?
Chart Data Analysis with GPT-4V
Let’s consider the following use case:
You are the CEO of company XYZ. Every week, your executive team presents multiple presentations, some of which contain data and visuals from various dashboards hosted within the vast cloud ecosystem of your company. Over time, as the number of presentations accumulate and new dashboards emerge, and old ones become more complex, there might be a need to map the presentations (ppts) and the dashboards contained within them to the correct live dashboards. This will help keep track of progress and allow for quick access to accurate information.
This is a perfect example of how GPT-4V can save you time and money. By providing all the necessary inputs, you can compare multiple dashboard images with multiple presentations, getting the job done much faster and more accurately.
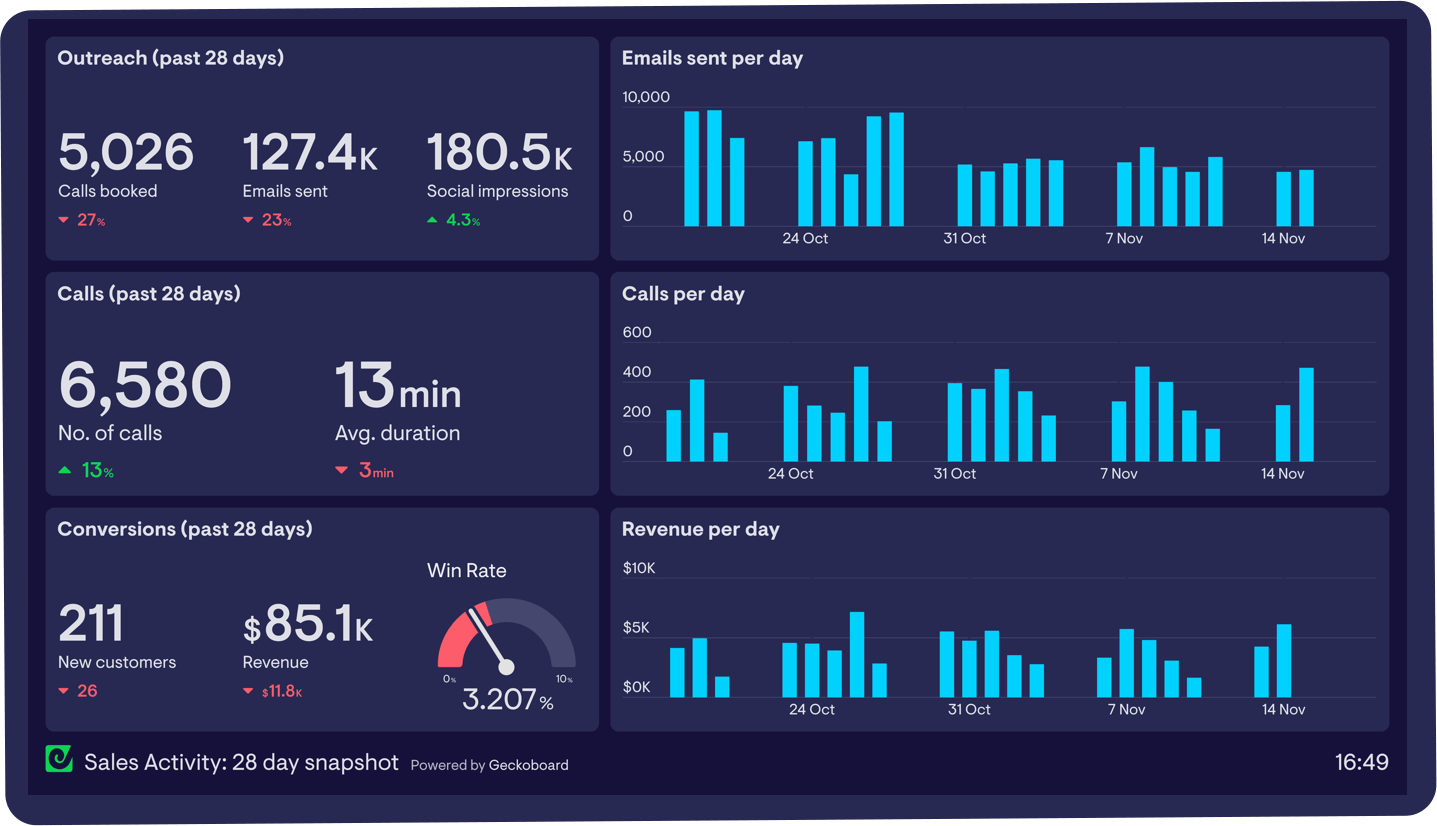
For simplicity, let’s assume we have one image inside the ppt which was snipped off from one of the live dashboards and three dashboard images, and we want to map the ppt image to one of the three live dashboard images.
The presentation image is called chart.png and is a chart screenshot taken from one of these three dashboard images.
The dashboard images are named dashboard_1.png and so on.
We would want the prompt to resemble how we would describe the task to a human: first providing the context, then specifying the images with their names, and finally asking for the correct match. In our case, the main prompt would look something like this:
```python

prompt = """You are an advanced Chart Comparing AI assistant designed to compare multiple dashboard and chart images and get the dashboard image that the chart image belongs to.

Given below is the chart image followed by the dashboard images, one of which contains the chart image. Examine them carefully and tell me which dashboard is it a part of."""

```
This is how we give context to the model. Next comes the image feeding step. We can either give url as shown above or if we have local images, we might convert them to base64 images and feed them to the model.
With that said, let’s create the final payload for our use case
```python
def encode_image(image_path):
  with open(image_path, "rb") as image_file:
    return base64.b64encode(image_file.read()).decode('utf-8')

base64_image_chart = encode_image('chart.png')

base64_image_d1 = encode_image('dashboard_1.png')

base64_image_d2 = encode_image('dashboard_2.png')

base64_image_d3 = encode_image('dashboard_3.png')

content = [
    {
        "type": "text",
        "text": prompt
    },
    {
        "type": "text",
        "text": "Chart image:"
    },
    {
        "type": "image_url",
        "image_url": {"url": f"data:image/jpg;base64,{base64_image_chart}",
                    "detail": "low"}
     },
     {
        "type": "text",
        "text": "Given below are 3 dashboard images that needs to be mapped to the target chart image by examining which dashboard it belongs to."
    },
     {
        "type": "text",
        "text": "Dashobard Image 1"
    },
    {
        "type": "image_url",
        "image_url": {"url": f"data:image/jpg;base64,{base64_image_d1}",
                    "detail": "low"}
     },
     {
        "type": "text",
        "text": "Dashobard Image 2"
    },
    {
        "type": "image_url",
        "image_url": {"url": f"data:image/jpg;base64,{base64_image_d2}",
                    "detail": "low"}
     },
     {
        "type": "text",
        "text": "Dashobard Image 3"
    },
    {
        "type": "image_url",
        "image_url": {"url": f"data:image/jpg;base64,{base64_image_d3}",
                    "detail": "low"}
     },
     {
        "type": "text",
        "text": "Your response:"
     }
]
payload = {
       "model": "gpt-4-vision-preview",
       "messages": [
                  {
                   "role": "user",
                   "content": content
                  }
                 ],
        "max_tokens": max_tokens,
        "temperature": 0.2,
        "seed": 42
 }

```
Here, we have given details of each image before passing it to the model, how the model should comprehend each image and analyze the whole payload. We have used the mix of text and image content types to give adequate details before showing any image to the model. This way we can prompt the model to do any kind of analysis for any number of images.
For our use case, we gave the below inputs:
Chart Image

Dashboard Image 1
Dashboard Image 2
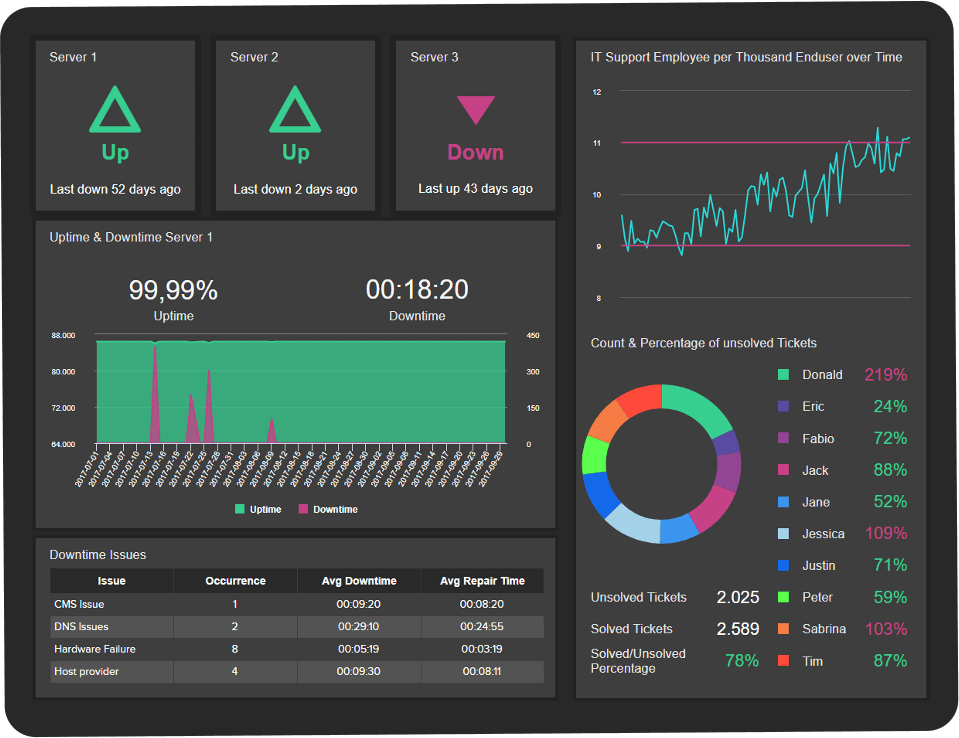
Dashboard Image 3
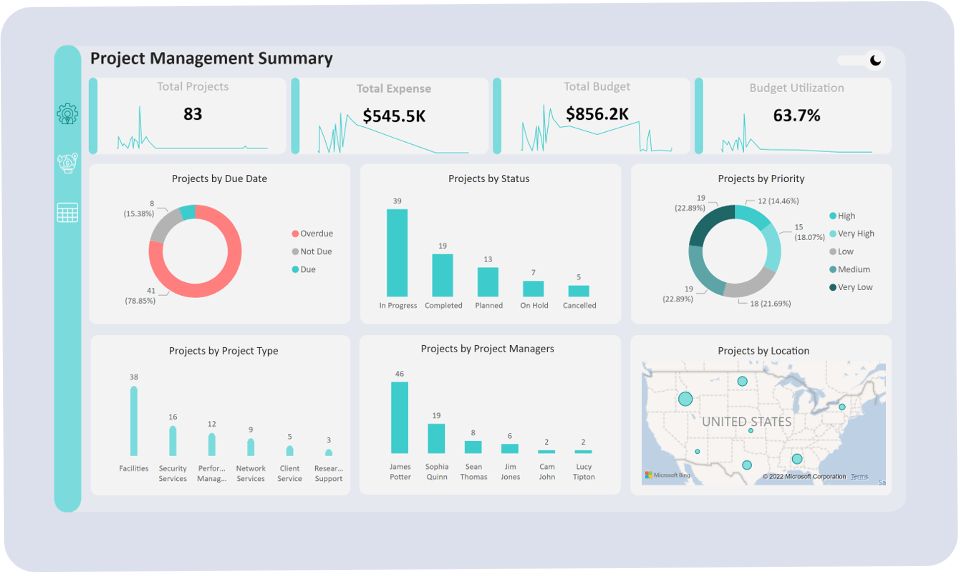
Output:
‘The chart image you provided is a bar chart titled “Revenue per day” with dates and revenue amounts on the axes.
After examining the three dashboard images:\n\n- Dashboard Image 1 contains a chart that matches the provided chart image. It has the same title “Revenue per day,” the same style of bar chart, the same dates along the x-axis, and the same revenue amounts on the y-axis. It is located in the bottom right quadrant of the dashboard.
- Dashboard Image 2 does not contain the provided chart image. The charts in this dashboard are different in style and content.
- Dashboard Image 3 also does not contain the provided chart image. The charts in this dashboard are different in style and content.
Therefore, the chart image you provided is part of Dashboard Image 1.’
So we can see, we get the right output from our given example using the prompt we designed for GPT-Vision.
Similarly, we could prompt the model to identify if the data contained in two graph images are same or different while moving from local to cloud based architectures. Many use cases can be solved using the above payload design. For each case, the prompt has to be changed in a clear and concise way with well-defined tasks, dos and don’ts.
GPT Vision vs Claude Vision – Which is better?
When we compared GPT-Vision and Claude Vision on our internal data, focusing on scenarios with graphs and dashboards, GPT-Vision performed better. It was more accurate at identifying the correct dashboards and analyzing the data within those images. This capability underscores GPT-Vision’s advanced visual understanding and its efficiency in processing complex image-based data. Along with comparison, we asked both models to also summarize the differences or similarities to which GPT gave better performance as well, concluding that it is better suited for this task.
Conclusion
As we’ve explored in this blog, GPT Vision is a game-changer in the field of image analysis, particularly when it comes to comparing charts and dashboards. Its ability to accurately identify similarities and differences between images offers immense potential for various applications across industries. While in this blog today, we focused on chart comparison, the broader impact of this technology is undeniable. As AI continues to evolve, we will see more sophisticated tools emerge. Tools, which won’t just aid us in how we analyze visual data but transform the process of insight extraction for good.


 Media Coverage
 Press Release
