 Media Coverage
 Press Release
Enhancing Tableau Dashboards with Interactive Visuals
How to Use Tableau Viz Extensions for Advanced Analytics
Customizing Data Visualization in Tableau
Introduction to Tableau Viz Extensions and Their Benefits
Step-by-Step Guide to Implementing Custom Visualizations
Best Practices for Creating Engaging Tableau Dashboards
Use Cases for Custom Visualizations in Tableau
How Tableau Viz Extensions Improve Data Storytelling
Exploring Popular Tableau Extensions for Better Insights
Integrating Third-Party Extensions into Tableau
Overcoming Common Challenges in Custom Visualization
When Tableau introduced Viz Extensions, like many of you I was excited. As someone who has been invested in the Tableau ecosystem for years, I was curious and couldn’t wait to dive into this new feature to fully understand its potential. This blog chronicles my journey as a Tableau enthusiast exploring one of the most eagerly anticipated features: Viz Extensions.
What Are Viz Extensions?
Let’s start with the basics – what exactly are Viz Extensions?
Viz Extensions are web applications that extend the native visual capabilities of Tableau, allowing users to interact with custom visualization types directly on their worksheets. Before delving deeper into Viz Extensions, it’s important to understand the concept of extensions in general.
Extensions enable you to add unique features to dashboards or integrate them with external applications seamlessly. Incorporating extensions into your dashboard layouts is straightforward – just like adding any other dashboard object. However, it’s worth noting that Tableau administrators have the option to disable dashboard extensions across Tableau Desktop, Tableau Server, and Tableau Cloud.
Tableau Extensions enhance worksheet functionality by leveraging web applications created by Tableau, its partners, and third-party developers. If you’re a developer interested in creating your own extensions, you can find comprehensive documentation on GitHub. Unlike dashboard extensions, Viz Extensions are added directly to a worksheet during the visualization creation process, rather than being added as a dashboard object.
How to Add Viz Extensions
Now that we have a grasp of what Viz Extensions are, let’s explore how to add them and what possibilities they unlock.
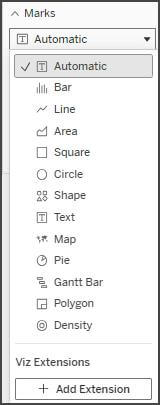
There are two primary methods for adding a Viz Extension to your worksheet via the Marks card:
1. Adding a Viz Extension as a Local File
- If you’ve already downloaded a Viz Extension from the Tableau Exchange, it will be saved on your computer as a .trex file.
- Open your Tableau workbook and connect to your data source.
- In the worksheet, expand the Mark Type dropdown menu on the Marks card.
- Under Viz Extensions, select ‘Add Extension’.
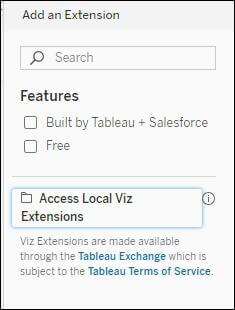
- In the ‘Add an Extension’ dialog box, choose ‘Access Local Viz Extensions’.
- Navigate to and open the saved .trex file.
- If prompted, grant or deny the Viz Extension access to the data in your workbook.
- The Viz Extension will load in the view, and the Mark Type will change to the name of the Viz Extension.
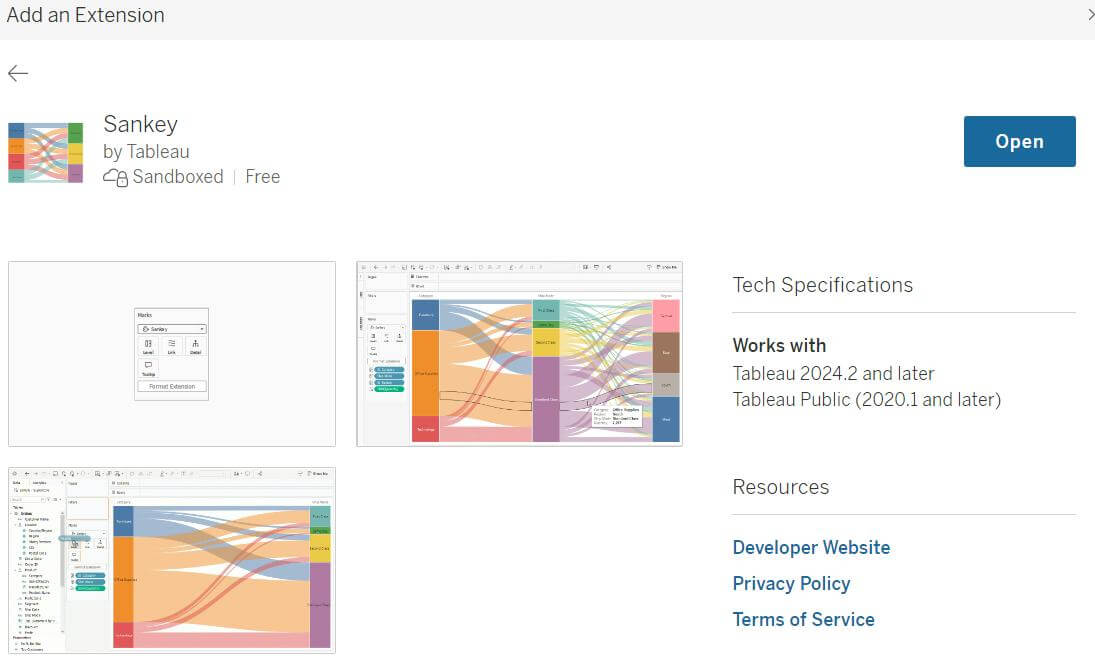
2. Adding a Viz Extension During Viz Authoring
- If you haven’t yet selected and downloaded a Viz Extension, you can do so while authoring your visualization.

- Follow similar steps as above, but instead of selecting a local file, choose the Viz Extension you want to load from the Tableau Exchange.
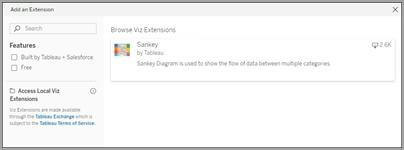
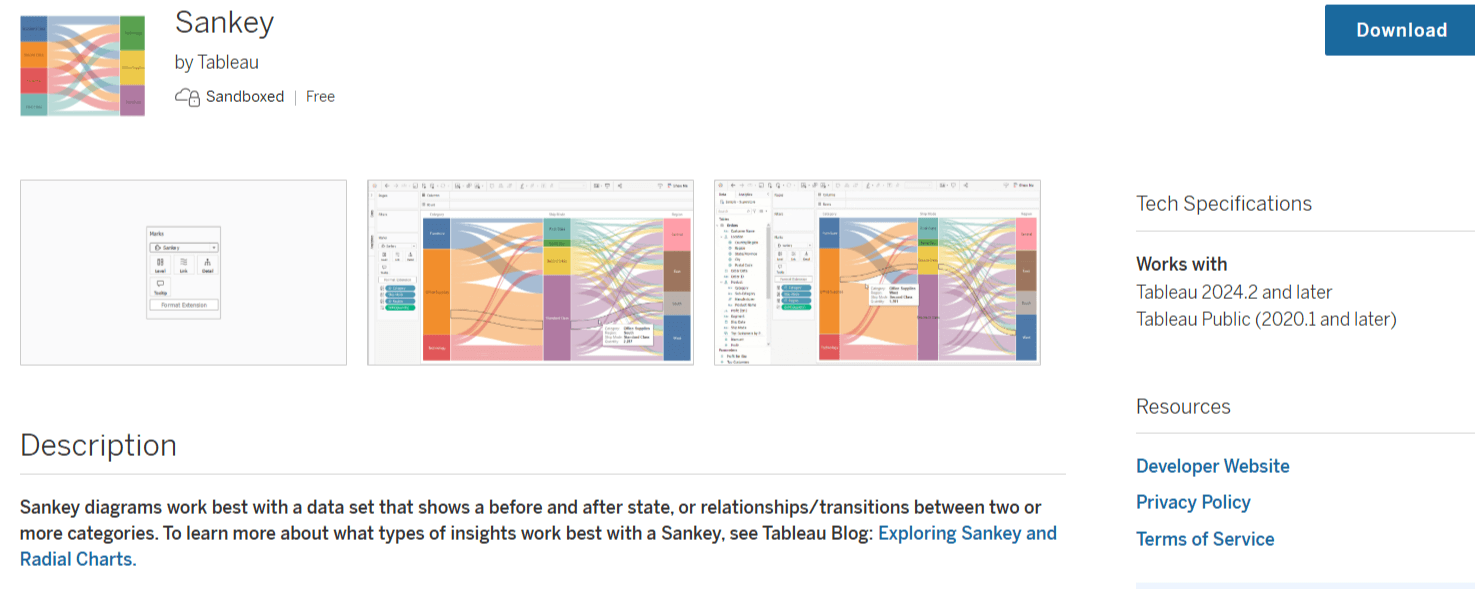
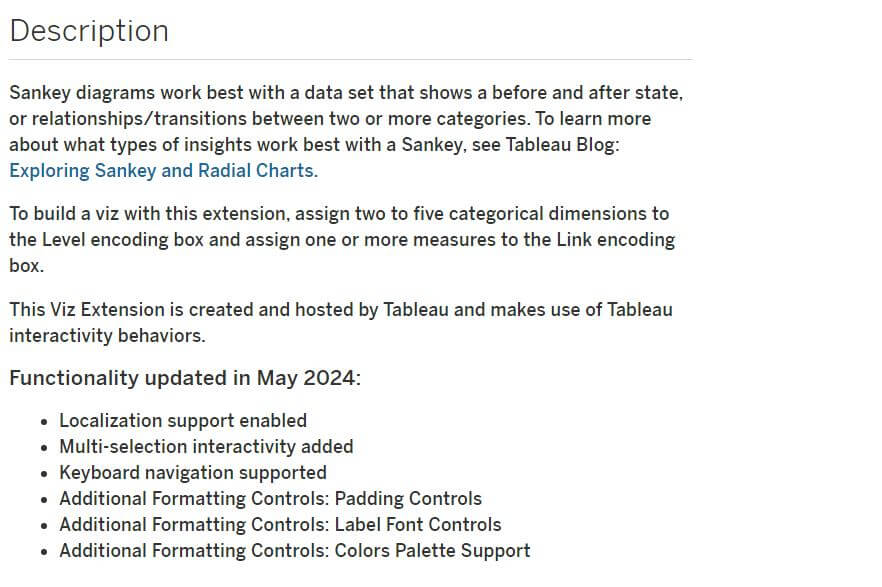
- For example, you might choose a Sankey diagram built by Tableau.
- Again, if prompted, grant or deny access to your workbook’s data, and then select “Open.”
If you encounter any issues adding a Viz Extension, ensure that extensions are allowed on your site. A Tableau administrator must enable extensions and manage network-enabled extensions in the allowlist. Administrators should only permit extensions that have been thoroughly tested and are trusted.
Understanding Extension Types
Extensions come in two forms:
- Network-Enabled Extensions: These run on web servers located outside your local network.
- Sandboxed Extensions: These operate within a protected environment, with no access to external resources or services.
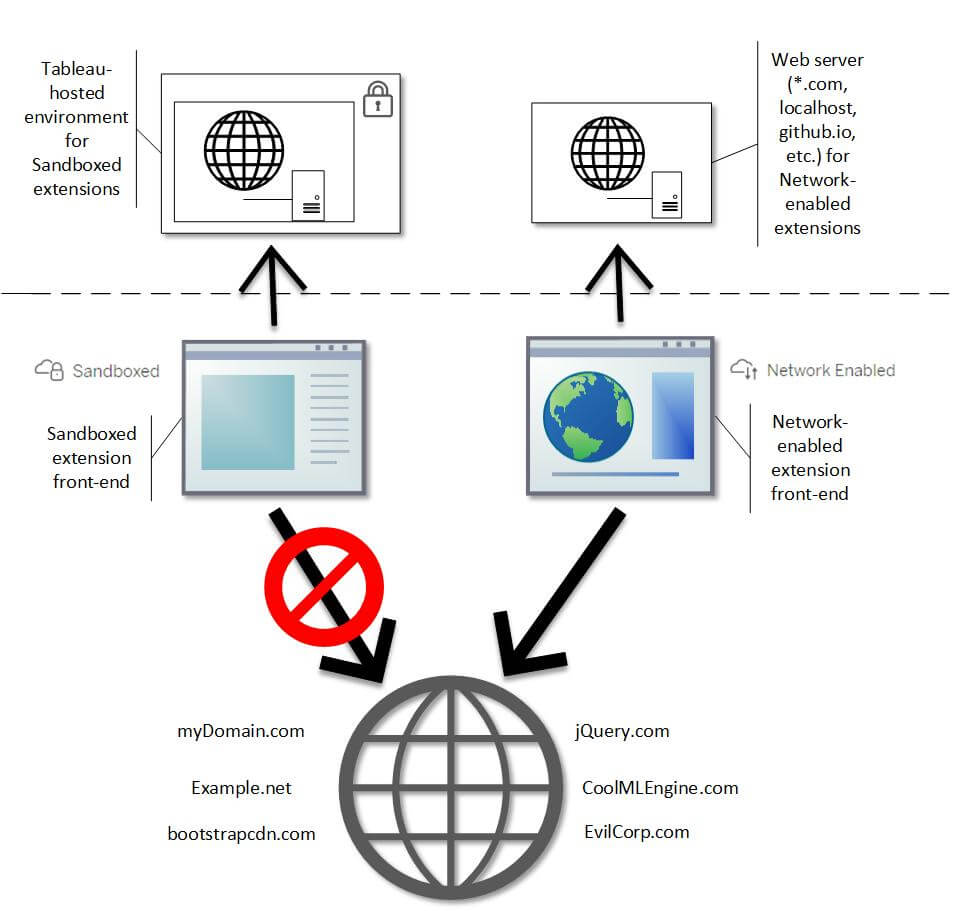
For more detailed information on data security related to extensions, you can explore the documentation available here.
Exploring the Tableau Exchange
The Tableau Exchange is your go-to platform for discovering Viz Extensions. You can search for specific extensions or filter for free ones. Each extension comes with a description, supported version details, and a list of updates. I found that the descriptions are particularly helpful for understanding how an extension can enhance the story you want to tell with your data.
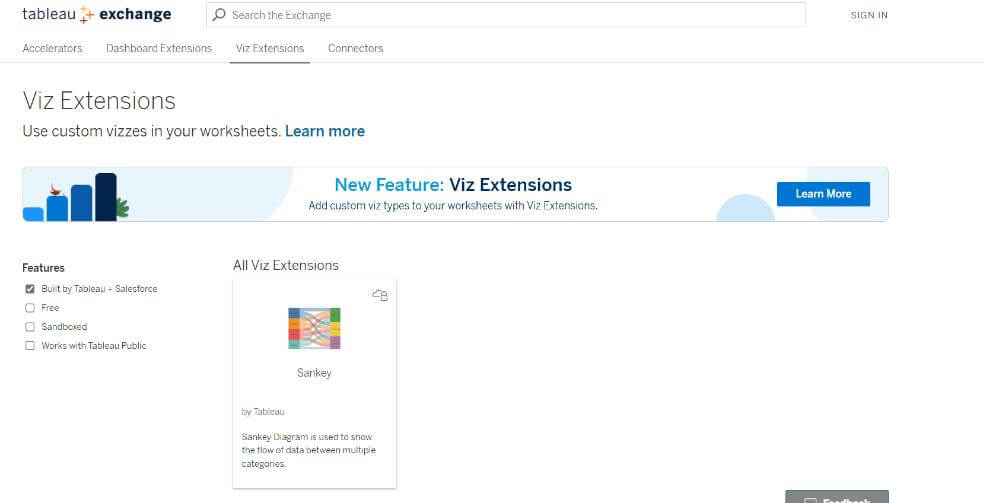
The “Resources” section allows you to verify the developer’s credentials and access their website.
How Can Viz Extensions Help Businesses?
Viz Extensions in Tableau can really change the way businesses ingest their data. They provide enhanced interactivity, customization, and integration of advanced analytics beyond the native capabilities of Tableau.
- Improved Decision Making: To better understand data, businesses at times require specific visualizations that cater to specific business needs. With Viz Extensions, business users can create custom-built charts and visuals that present complex data metrics in an easier way for stakeholders to understand, leading to improved decision-making.
- Enhanced Integration: With extensions, the horizon of actions which can be achieved is phenomenal. Users can pull data from external business systems to get a more accurate picture of how the business is performing. With some extensions, users can even trigger actions in other systems depending on user interactions. Thus, the extensions overall boost the integration of Tableau outside its ecosystem.
- Efficiency: Extensions can really improve the efficiency of businesses. By using automation, repetitive tasks such as updating specific metrics based on real-time data can be streamlined, which will save time. Also, the collaborative features, like the ability to leave comments directly on dashboards, can help teams work together more efficiently.
- Improved Data Insights: Extensions allow users to filter their data in a much more advanced way with various drill-down options, which are much more flexible than the default Tableau options. The ability to apply machine learning models and predictive analytics directly to dashboards changes the way users explore the data. It allows business users to identify the risks with the forecasted trends all within Tableau.
Final Thoughts
While Viz Extensions open up a world of new possibilities, it’s essential to approach them with the same level of scrutiny as any other software deployed in your organization.
Testing and verifying the security and functionality of these extensions are crucial before integrating them into your workflows.
There are different deployment strategies for managing extensions:
- Allow All Extensions
- Only Allow Sandboxed Extensions
- No Extensions Allowed
Developing a deployment plan with data security in mind is key to maximizing the benefits of Viz Extensions. However, I’ll save that discussion for another time to keep this article concise.
Source: Tableau Documentation