 Media Coverage
 Press Release
Mastering Tableau Filters: Essential Tips for Data Visualization Success
Elevate Your Tableau Game: Unlock the Power of Advanced Filtering Techniques
Enhancing Data Visualization with Tableau Filters: Pro Tips and Strategies
Introduction
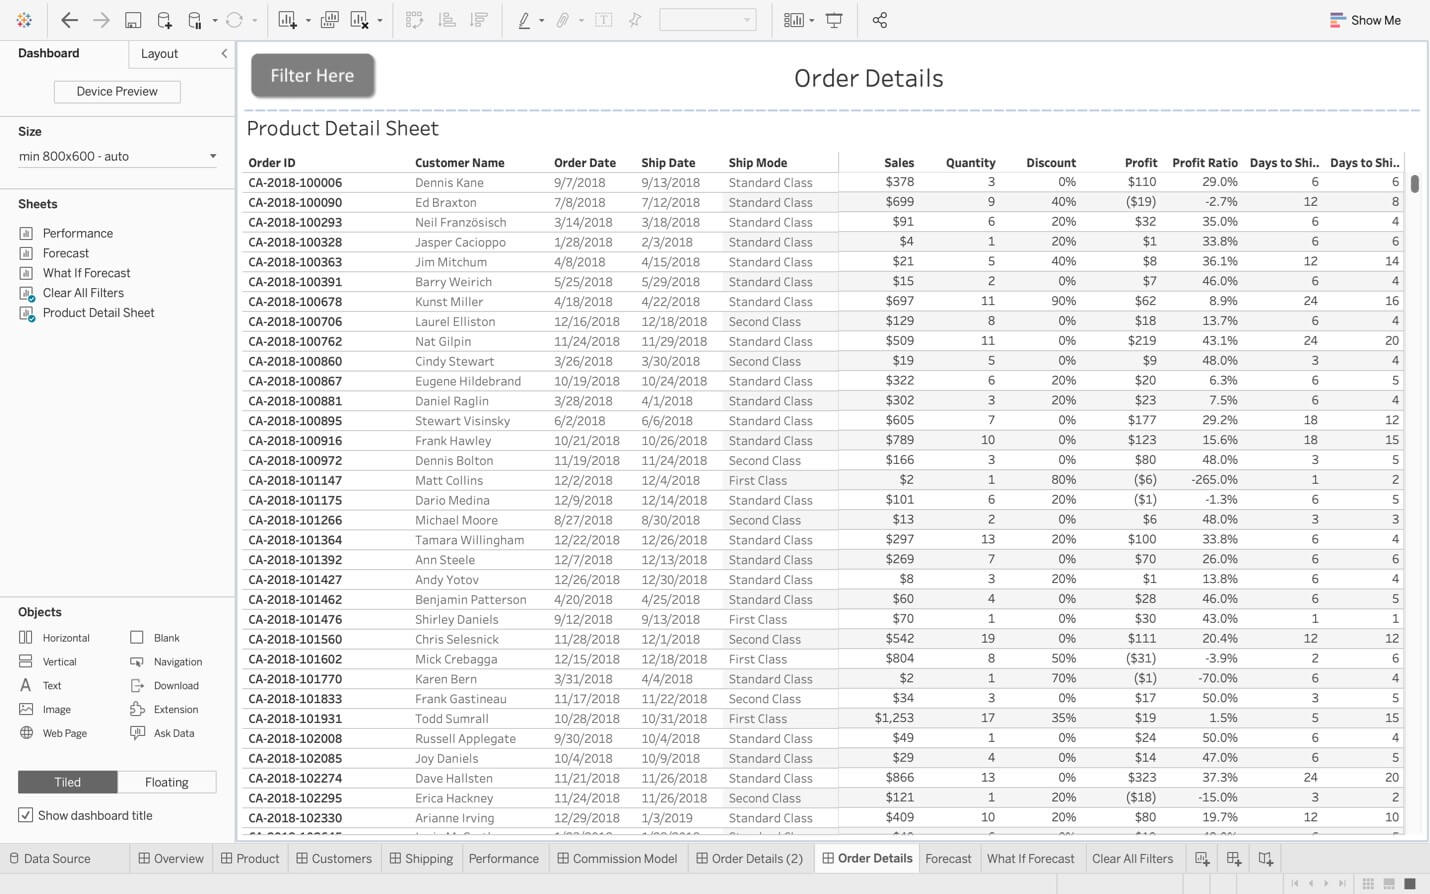
This article will include two useful tips when you have multiple filters/parameters in a single dashboard. The following demonstration will be using the Order Details dashboard in the Superstore sample workbook, you can find it while launching the Tableau desktop.
Tip 1: Clear All Filters Button
Have you ever faced this situation? There are many filters in one dashboard, you want to clear all filtered values at once, but it’s kind of tedious to click the filters one by one. We can create a Clear All Filters button so that one click will easily revert all filters to show “All” values. Here are the steps:
Understanding Tableau Filters: A Comprehensive Guide
Best Practices for Applying Filters in Tableau Dashboards
Optimizing Performance: Strategies for Efficient Filtering in Tableau
Improving User Interaction: Tips for Interactive Filtering in Tableau
Exploring Different Types of Filters in Tableau
Advanced Filtering Techniques: Beyond the Basics
Performance Optimization: Streamlining Filter Actions in Tableau
Creating Dynamic and User-Friendly Filters in Tableau
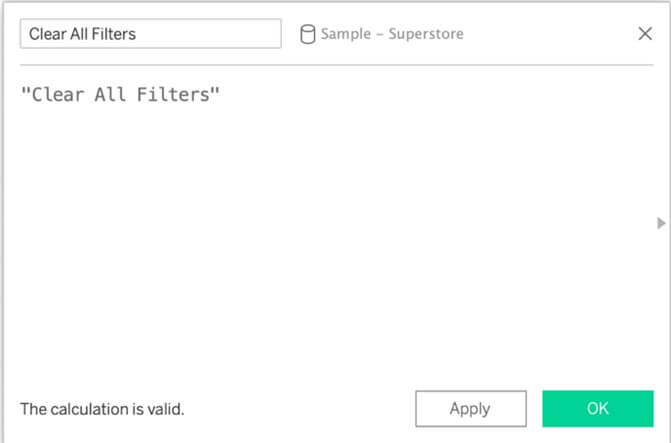
Step 1 – Creating a Calculated Field
First, Let’s create a calculated field by clicking the dropdown on the left data pane, rename the calculated field to “Clear All Filters”, and do the same for the body part with a quote mark, then click Ok.
Step 2 – Adding the Clear All Filters Worksheet
Then, drag that calculated field to the text shelf on a new empty worksheet. Changing the view option for the worksheet from “Standard” to “Entire View” and renaming the worksheet to “Clear All Filters” are optional but they are good practices for later steps.
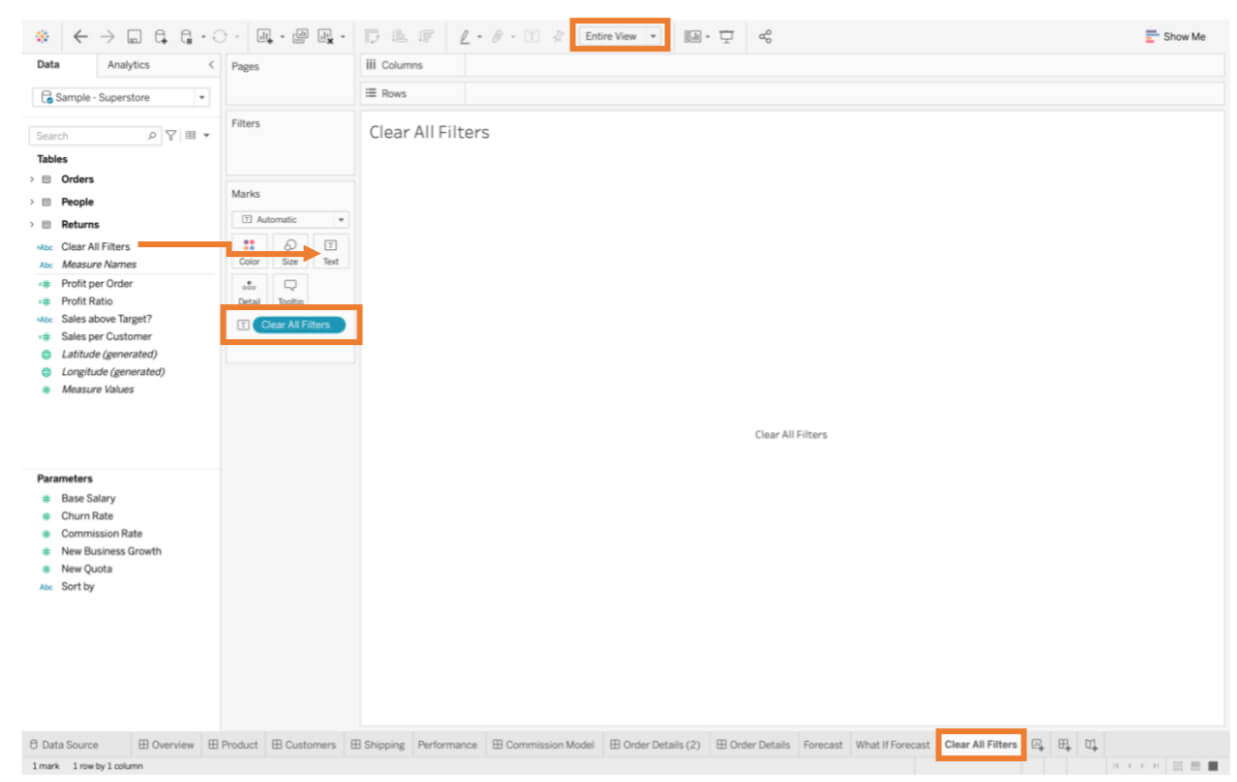
Then simply add the Clear All Filters worksheet to the Order Details dashboard and click the dropdown of worksheet to hide worksheet title.
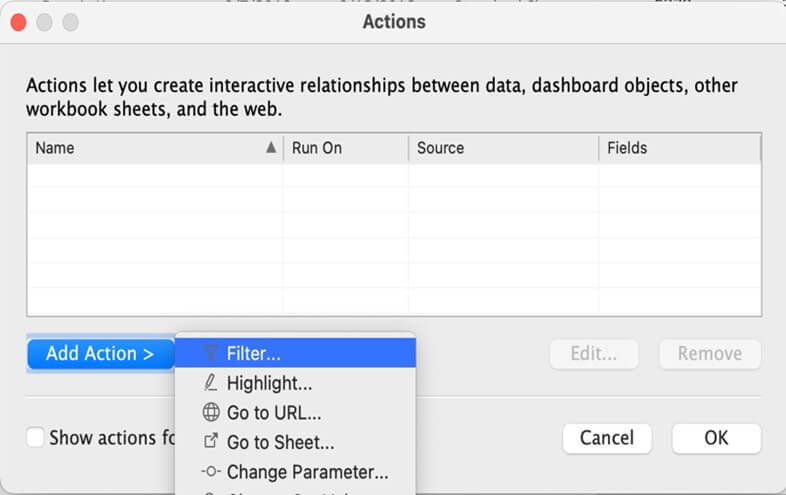
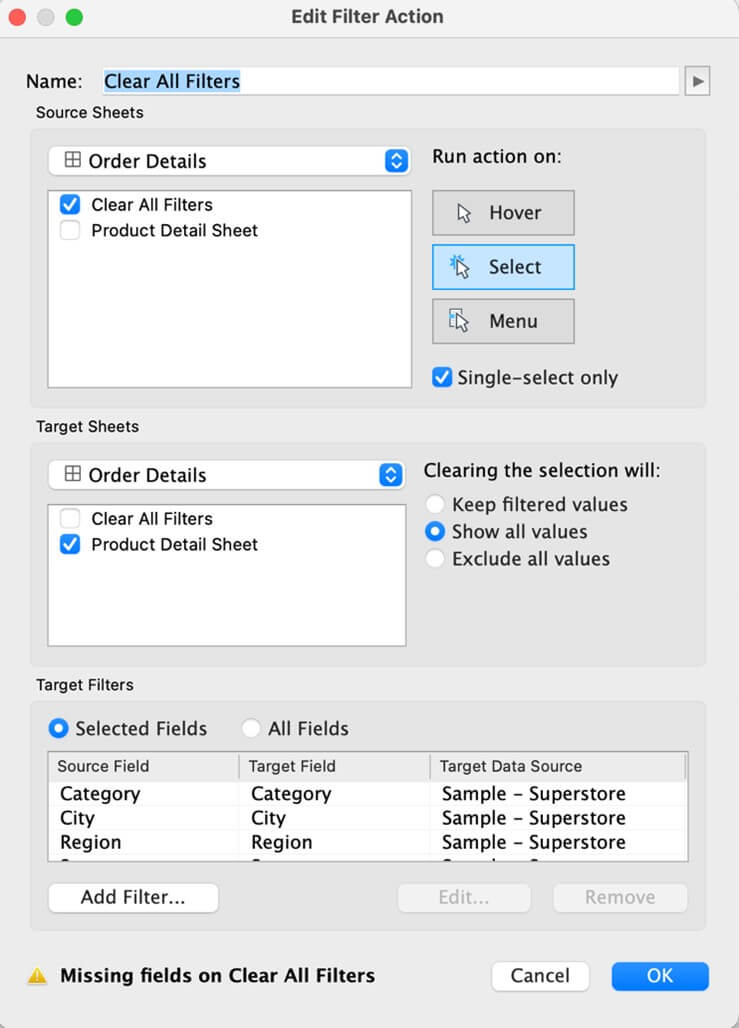
Step 3 – Setting up the Filter Action
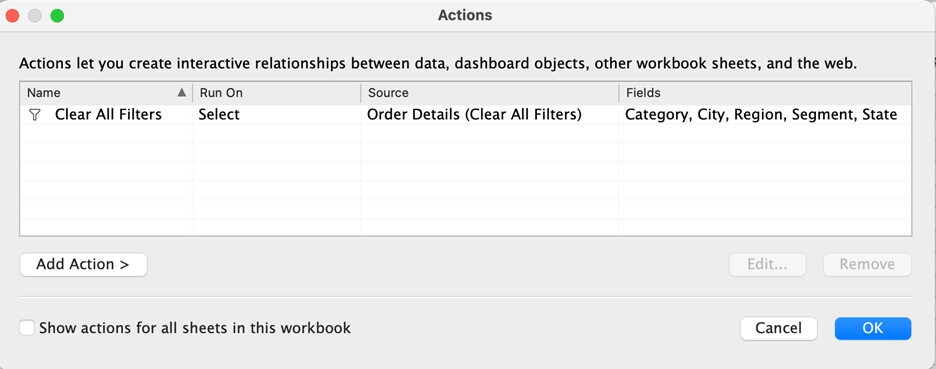
The next important step is adding a action between the button and filters. Open the Actions window by nevigating to the Dashboard tab on the top of the screen and selecting “Actions”. Go to “Add Actions”, then select “Filter” to open the filter action window.
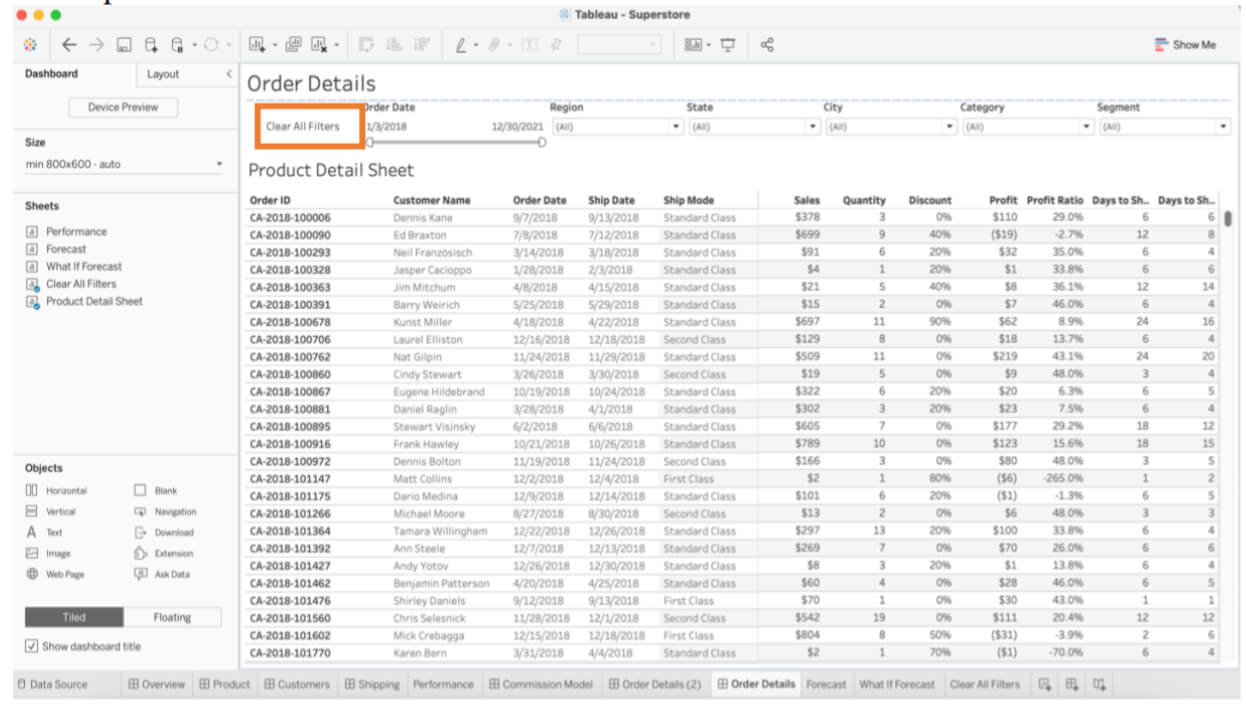
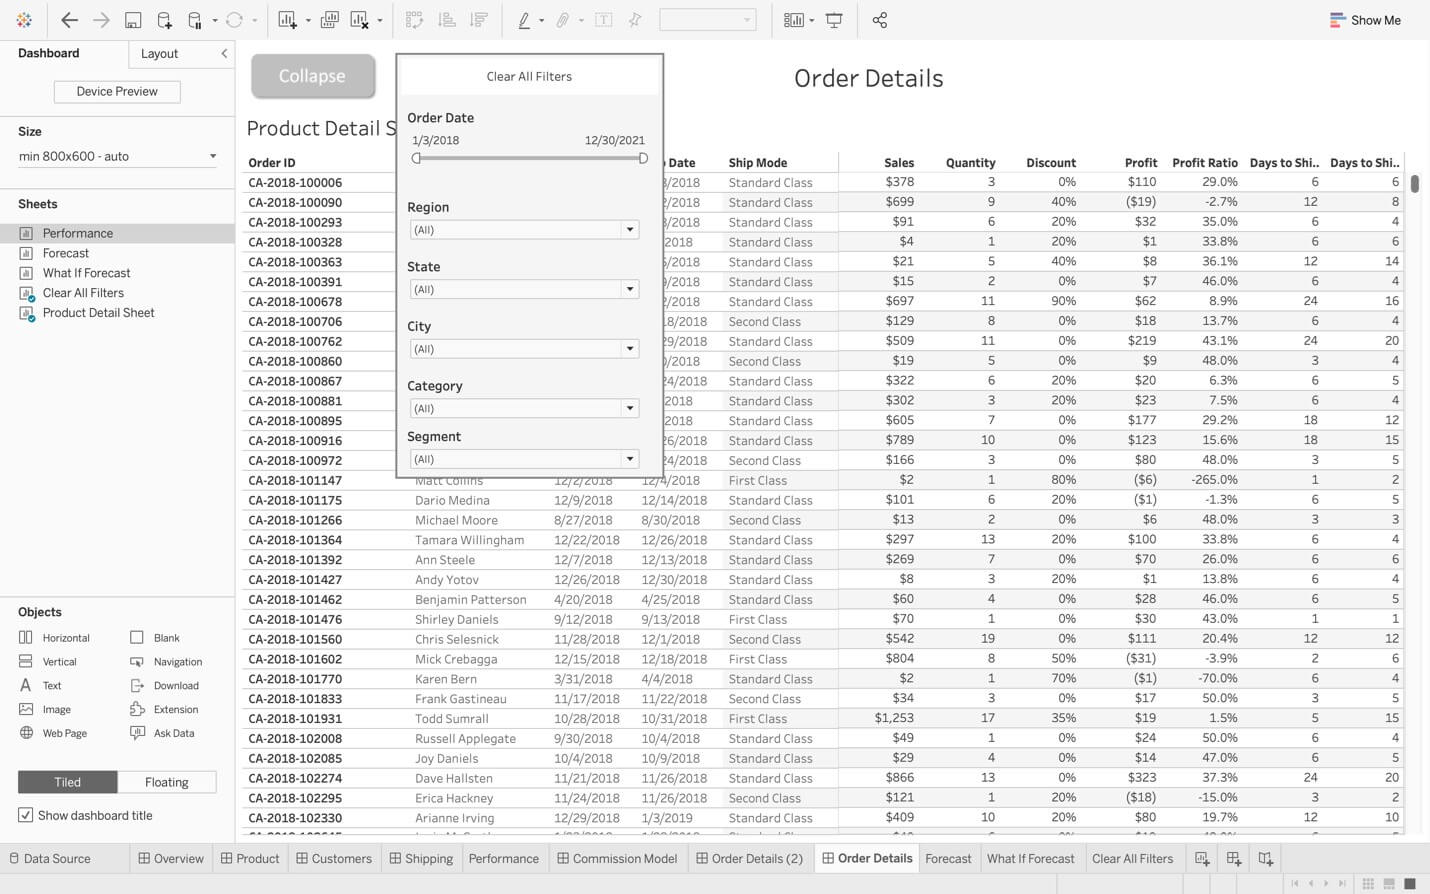
Below is the filter window. “Source Sheet” will be the Clear All Filters worksheet and the target sheet is the main table Product Detail Sheet. For the other two options on the right, we will run actions when “Select” and clear the selection to “show all values”. Then at the bottom of the window, choose “Selected fields”, and all fields that are being used as filters on the view. Click Ok then we are good to test the button function!
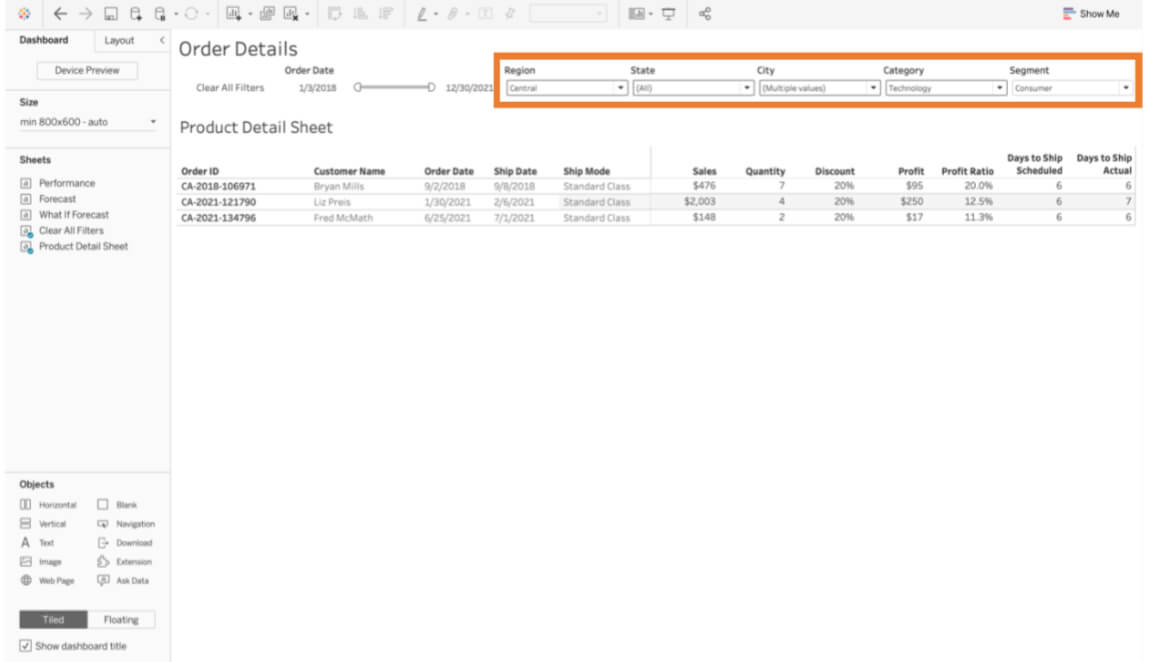
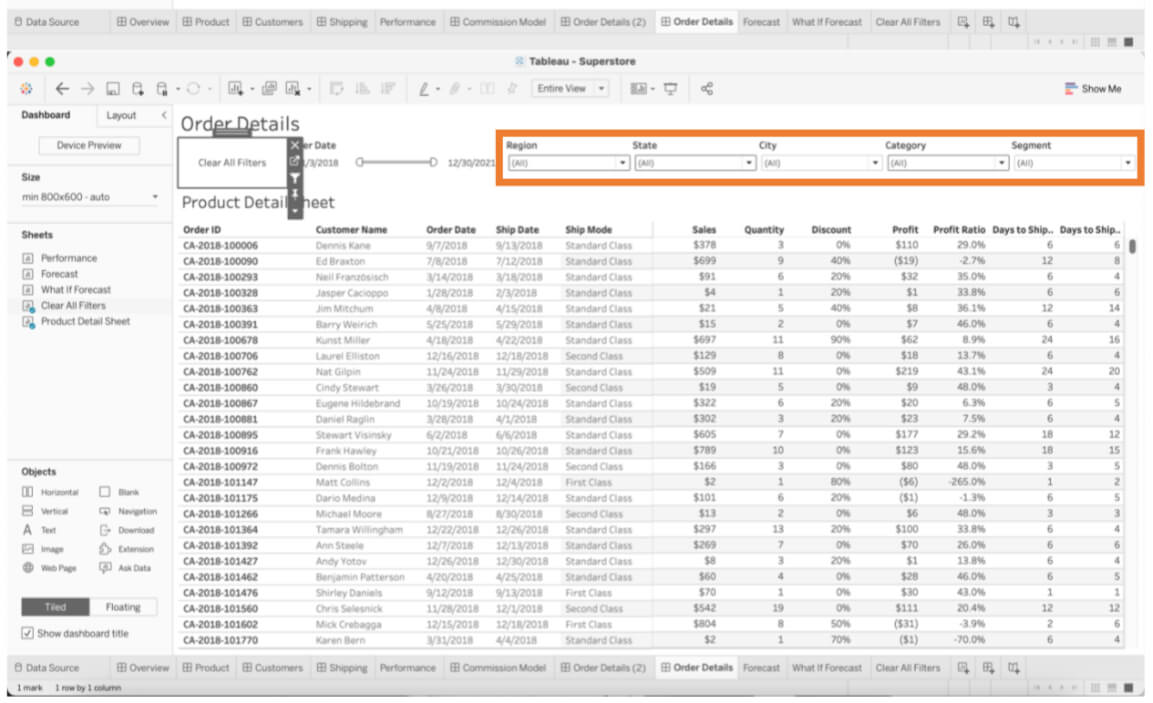
Now, when you click the Clear All Filters button on the dashboard, all filtered values will be reverted to “All” as their original setting.
Tip 2: Filter/Collapse button
We might have a dashboard that has a lot of filters that occupy too much space of the dashboard so that views cannot present appropriately as we expected, or sometimes we just want to collapse filters and parameters to have some creative design for the dashboard. In that case, we could add a Filter/Collapse button to show/hide filters and parameters as needed for maximizing dashboard space.
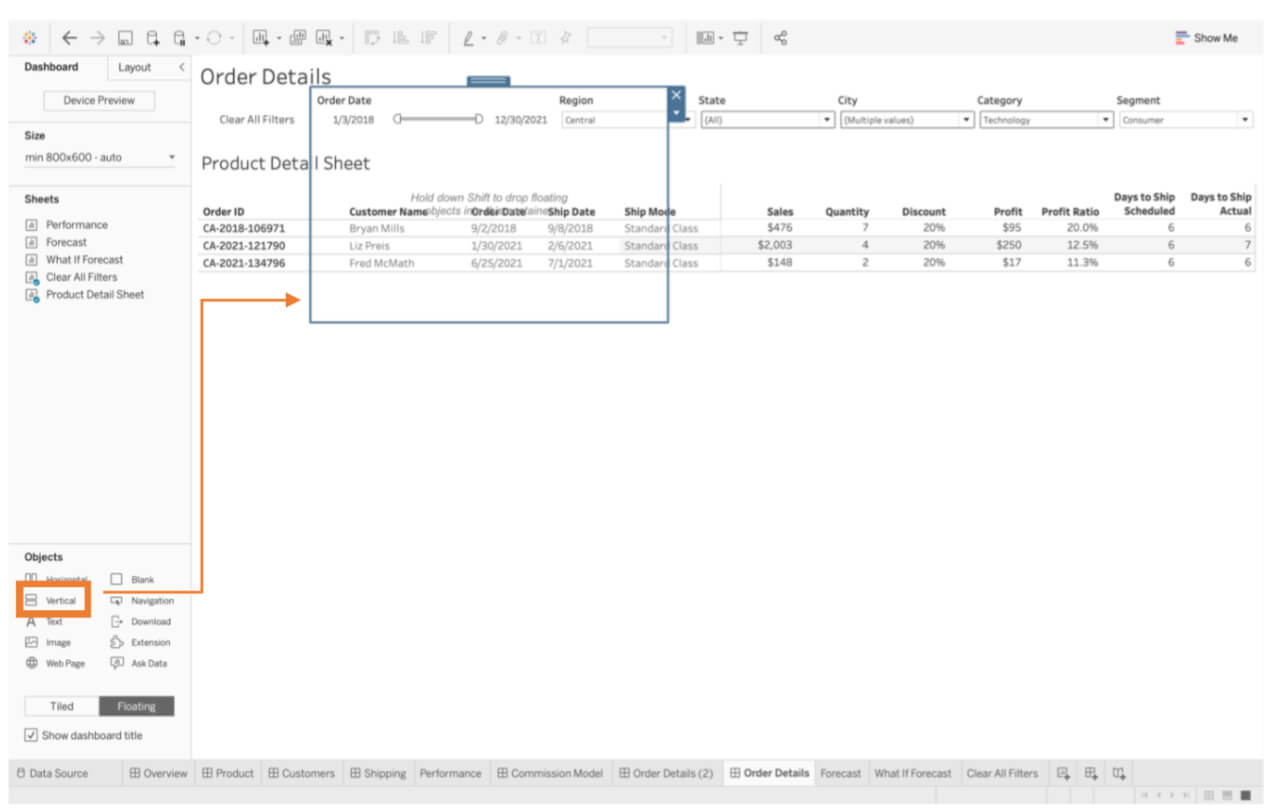
Step 1 – Adding a Vertical Container
First, we will need to drag a vertical container from the Objects shelf to the dashboard as a floating item, rename it as “Filters”
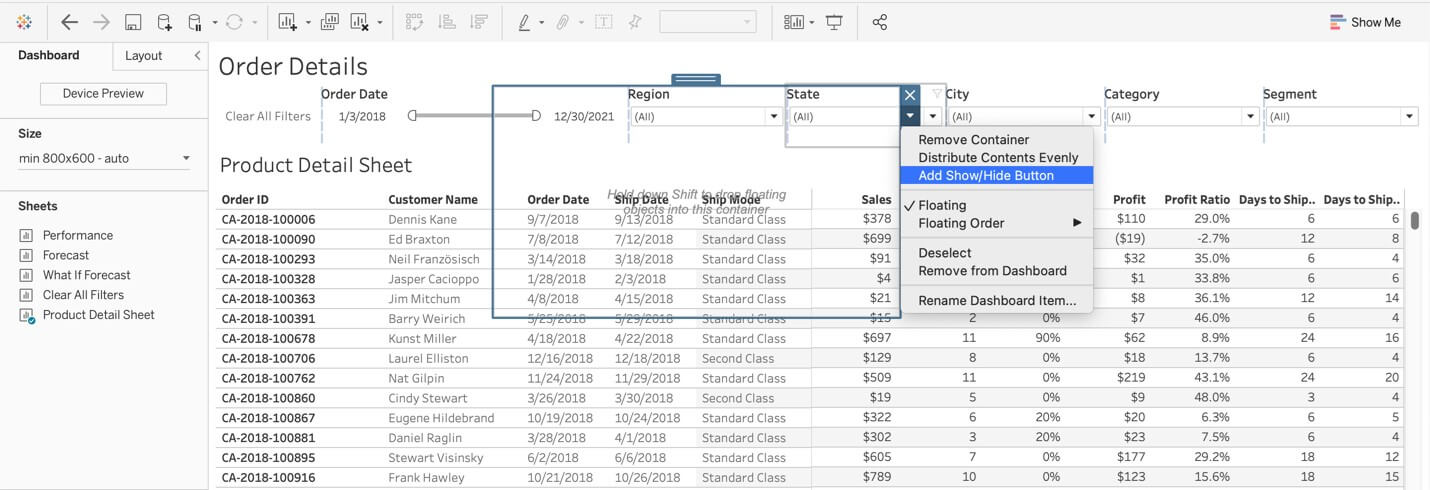
Step 2 – Adding a Show/Hide Button
Then, click the dropdown of the vertical container and select “Add Show/Hide Button”, then a button object (a cross mark) will be shown in the view, click the dropdown of that button to select “Edit Button”.
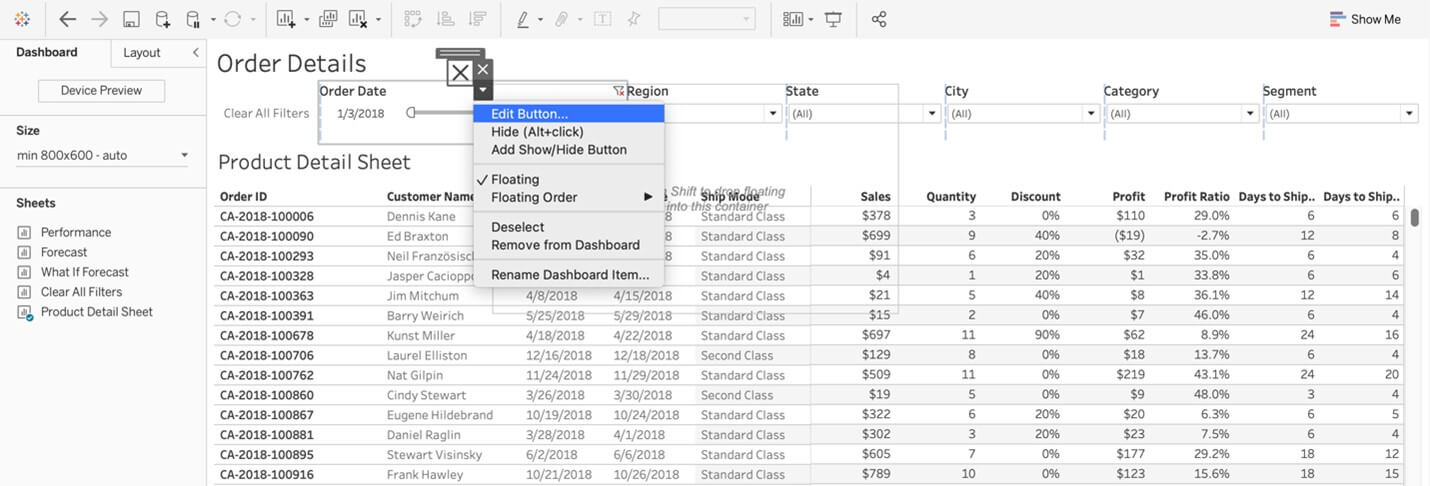
Step 3 – Customizing the Button
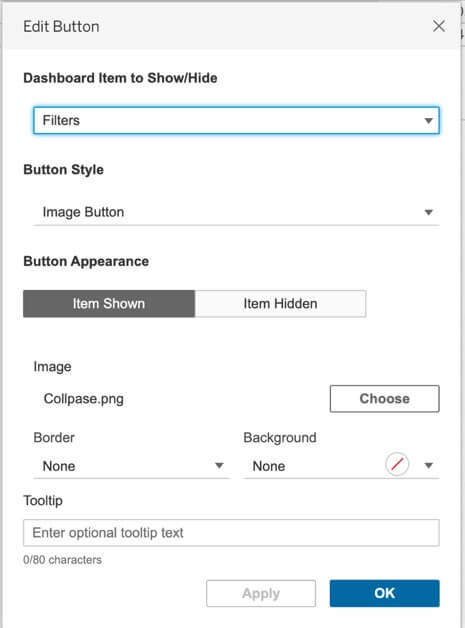
Here is the window for editing the button. “Dashboard Item to Show/Hide” is the vertical container we just created named “Filters”, then you can select the button style you like, but here we will use the image button, then, uploading the images for item shown and image for the item hidden. You will see the button once clicking Ok.
Step 4 – Organizing Filters and Parameters
The last step is dragging all necessary filters and parameters and Clear All Filters button in the vertical container, then using the shortcut “Alt + Click” to show or hide the container as needed. Now, we can see that much space for filters is saved and more rows are presented in the view.
Thank you for reading this article, hope these two tips could give you some inspiration when designing your own dashboard!