Simplifying Time Series Forecasting with Salesforce
Mastering Time Series Forecasting: Techniques and Applications
Leveraging Salesforce for Simplified Time Series Forecasting

Stability, consistency, and planning are key for any business growth opportunities.
We have evolved over hundreds of years and the world today looks very different from what it was earlier.
In this scenario you may ask, what is the need to look at historical data when over a period thing evolve like they had never existed.
Understanding Time Series Forecasting Methods
Applications of Time Series Forecasting in Business
The answer is everything that happens has a cyclic pattern, we all know the famous saying that history repeats itself.
So, while things may not look the same, but the patterns are very much the same.
Some examples are reflected in below image, how different is this from the view in metros today. The newspapers are just replaced by mobile phones.
Streamlining Forecasting with Salesforce Tools
Enhancing Decision-Making and Planning with Time Series Forecasting
Exploring Different Time Series Forecasting Techniques
Benefits of Implementing Time Series Forecasting in Your Business
How Salesforce Tools Simplify Time Series Forecasting
Best Practices for Effective Time Series Forecasting with Salesforce
An important observation from below one can make is while medium advances and improves human needs the patterns remain the same.

Another famous example will be looking at pandemics like COVID which have occurred several times in history before.
The measures followed were just the same.
An important lesson to learn from this is, even during the worst days which feel like they have caused huge impact there comes back a period of normalcy! Did we ever expect life to back to usual post COVID pandemic, I for one did not, but it is, defining the concept of cyclicity.
How these examples help my case is it’s important to look at below factors to ensure sustainability and longevity of businesses:
- Trends – which direction is your business flowing in – which can help decide/evaluate the demand
- Seasonality – when does something work, and when does it not
- Cyclicity – To be prepared well in advance of the pattern that you see when you can carefully look at the time gap in which events occur.
- Noise – while these are just random patterns or events that happen out of blue can help identify how far from the “Level” can we go, is there something new coming in, is it going to build momentum.
When we have a greater understanding of time series data based on above factors it is possible to predict future volatility and come up with some accurate forecasts that help us in ways like:
- Risk Assessment:
- Do some negative forecasting to gauge risks
- Track lost deals or due to crisis
- Sales Planning
- Inventory Planning
- Resource Planning
Some key concepts to note are:
- We need to have accurate data with high frequency process for updating this data.
- We can apply two kinds of transformations to our data:
- Linear transformation which estimates the underlying mean function
- Linear transformation to identify deeper understanding of actual random pattern
- When we do forecast the forecasted prediction must be on aggregated level for higher accuracy
- Follow the horizon rule, keep the forecast date as short possible for accurate forecasts
- Min of 5 data points for any seasonality
- 2 seasons worth of data for 12 months seasonality
Since Sales Forecasting plays such a key role in running the business, we will walkthrough how Salesforce enables stakeholders who are not necessarily data scientists, to move quickly on their time series problems and make high quality forecasts.
How CRM helps?
Sales Cloud provides a real time view of your entire team’s forecast. So, with Sales Cloud being used to capture and maintain data you do not have to worry about collating data and bringing them in place for a unified experience that tells the complete sales story.
By using Sales Forecasting in Einstein Analytics Sales Manager can identify if they are on track to meet targets by using these predictions.
CRM Analytics uses Holt Winter’s method as it can capture all level, trend, and seasonality and therefore the additive method in the smoothing techniques is able to forecast the sales closer to actual values.
Ways to Implement Time Series?
There are two ways in which we can use time series forecasting methods in Salesforce CRM.
SAQL Calculations:
Statement with timeseries function can be used to generate time series predictions.
Please refer link to know more in detail.
result = timeseries resultSet generate (measure1 as fmeasure1 [, measure2 as fmeasure2...]) with (parameters);In the parameter function you can mention optional details like:
- Model – since Salesforce calculates prediction for each model(additive/multiplicative) and selects best model using BIC, this gives us a relief from trying to do analysis on the whether the data has linear or exponential variance with time.
- dateCols – this is another optional parameter, point to note that predictions are aggregated and hence looking at them based on “Y”, “Y-Q”, “Y-M” will be more accurate than the “Y-W” or “Y-M-D” options.
- Partition – is other interesting optional parameter where you can specify time series predictions based on a particular column, you can create separate result sets for seasonal and non-seasonal data and look at the forecasts based on that for a deeper view

Transformations in Recipe:
Salesforce has made this further easier with Time Series feature in Transformation node, which is available in Recipe.
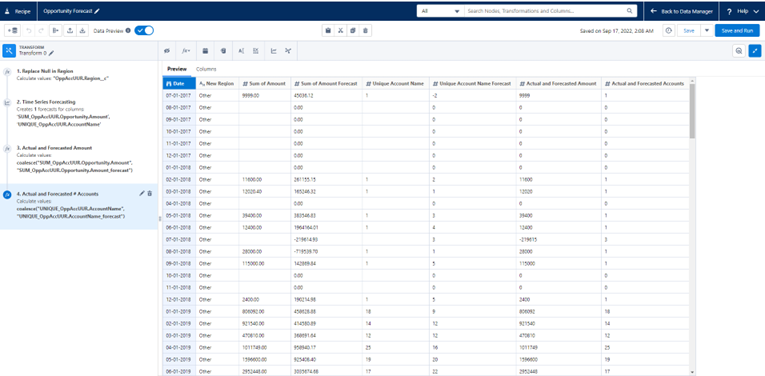
a). In the recipe data model, I would like to look at forecasts based on Close Month and Region and since I have a few null values in region, the first step was to replace null from region column

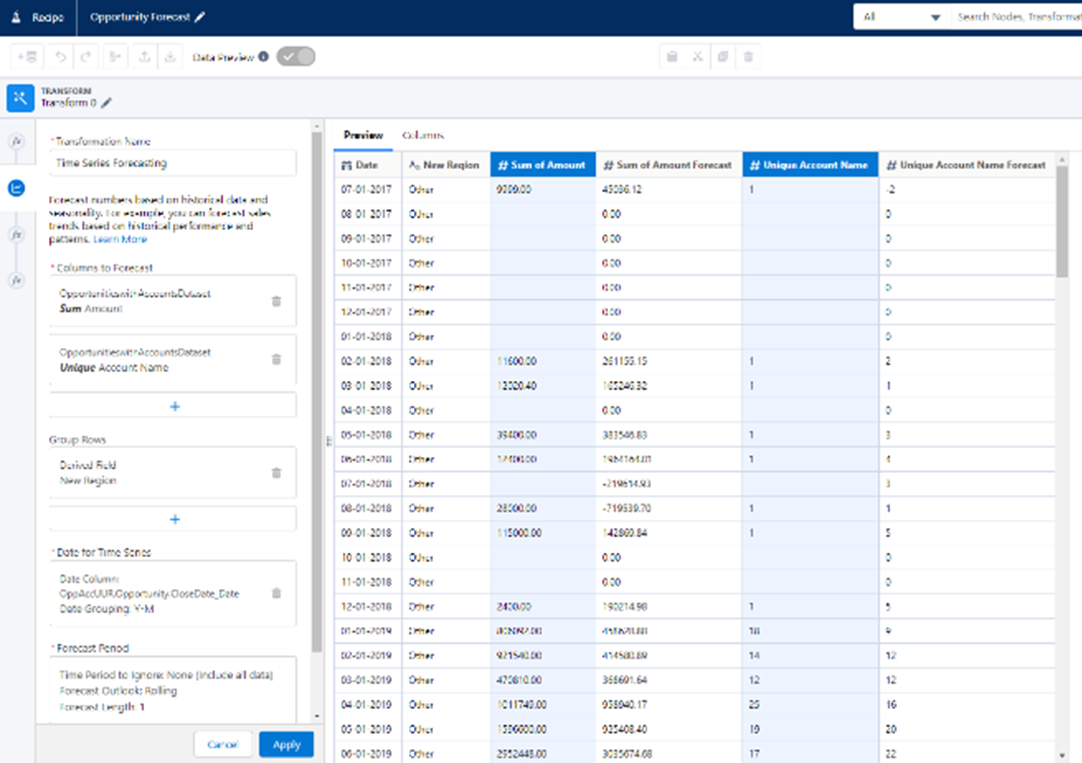
b). Select the time series node for time series transformations and chose the values you want to predict as aggregated measures. Aggregation is done for increasing accuracy of predictions.

c). Group Rows – this option can be used to perform predictions by a certain dimension. Multiple dimensions can be applied, some can follow seasonal pattern and other may not.
d). Date for Time Series Format – I have selected close date in my example as it is an indicator of actual date for when the deals were won, and hence true indicator of a sale made
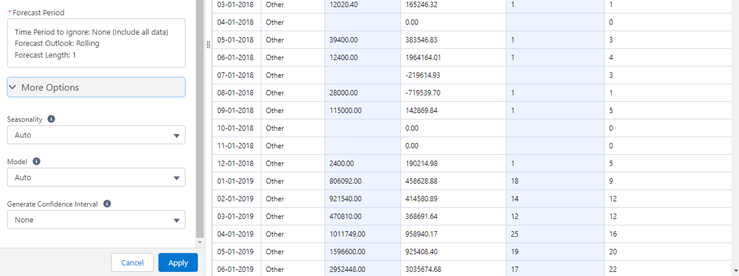
e). For seasonality, if you already are aware of the fluctuation pattern in your sales you can select one value, else I recommend using Auto as CRM analytics automatically identifies the pattern for you
f). For Model selection – as already mentioned in CRM analytics we don’t need to go through the trouble to analysing the data and checking whether the variance in pattern in linear of exponential we need can use Auto in most cases
Note: Since CRM analytics is using Holt-Winters smoothing technique it takes into consideration trends, seasonality and level and hence making an auto selection to these options in most cases in the best choice.

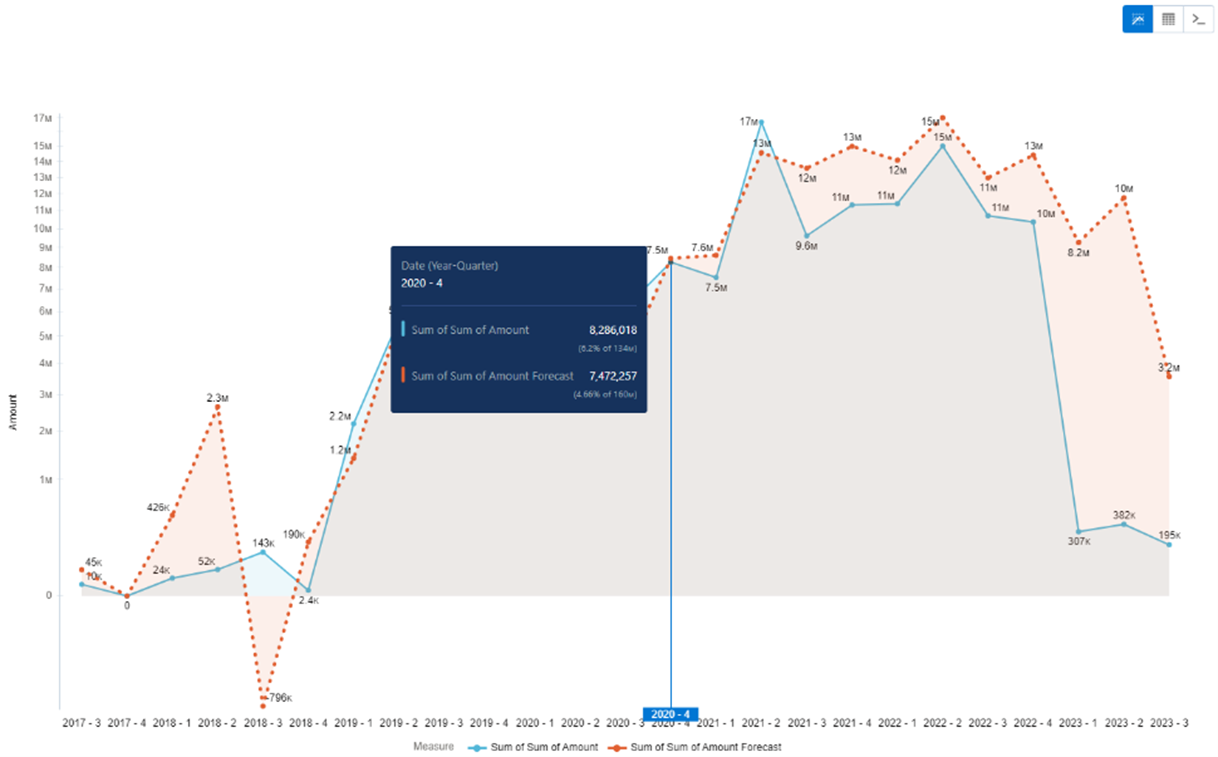
g). Below is a graph indicating two-line charts with Actual and Forecasted values and can be seen that they are very close with high accuracy levels.

Conclusion:
I’d conclude this article by stating that yes, while the Time Series Forecasting transformation does not cover every aspect of a complex data series forecast, but it has been developed in a quintessential manner that provides accurate forecasts and can be easily used by companies to plan and mitigate ahead, without any dependencies on a team of data scientists.
Salesforce has done a good job of enabling the Biz Ops, Sales, and Company Leadership Teams.
With continued effort to provide an “Intelligent CRM” platform and reduce the average time spent by salesperson in operational work, thereby increasing productivity.
This feature reduces the effort of forecasting by about 50%, where all we need to ensure is “true” data and latest data is maintained in our CRM system.


 Media Coverage
 Press Release
