 Media Coverage
 Press Release
Advanced Tableau Prep Tutorial
Uncover Deeper Insights with Data Tiling
USEReady’s Guide to Data Preparation

Tile calculations, a powerful yet often overlooked feature in Tableau Prep, are feature for segmenting and analyzing data. By dividing your data into distinct buckets, you can uncover hidden patterns, trends, and opportunities. In this tutorial we will delve into the mechanics of tile calculations, providing practical use cases to showcase their application.
However, before exploring how to create effective tile calculations, let’s first understand what tile calculations actually mean? A tile is a division or bucket of your data based on some calculation. And this calculation is called a tile calculation. Tile calculation basically divides your data equally into specified number of buckets. You specify the field that needs to be divided, field that will be used to divide and number of buckets or tiles.
Introduction to Data Tiling in Tableau Prep
Benefits of Tiling Data for Analysis
Step-by-Step Tableau Prep Tutorial
Real-World Applications of Data Tiling
Overview of Data Tiling Concepts
Preparing Your Data in Tableau Prep
Key Techniques for Effective Data Tiling
Enhancing Visualizations with Tiled Data
Use Case 1
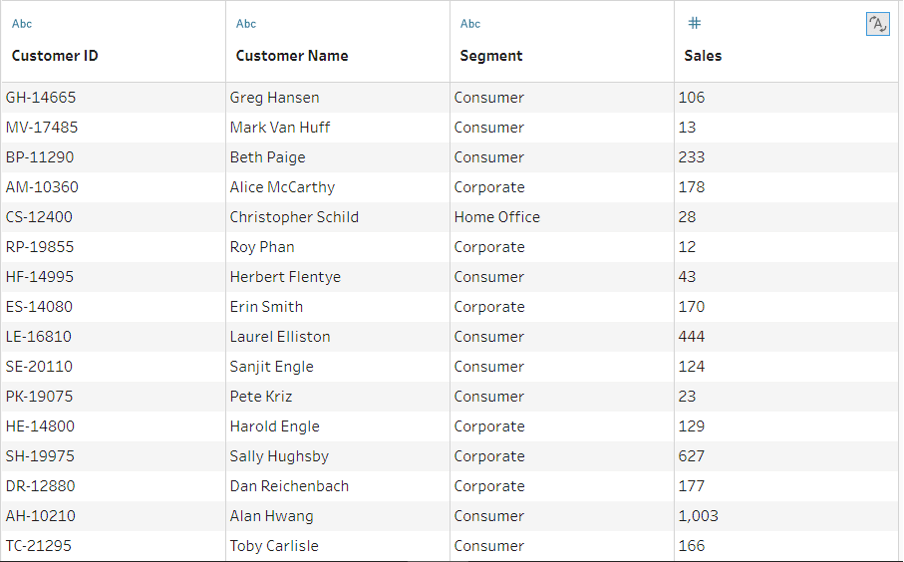
Let us understand tile calculation by looking at an example. Suppose you have customer sales data with customer ID, customer name, segment, and sales value. A business question you can ask is – which customers contribute to my overall top 50% sales and overall bottom 50% sales.
To find out, we will create a tile calculation to divide our whole dataset into two parts – Bucket 1 will contain top 50% customers and bucket 2 will contain bottom 50% customers.
To create tile calculation, choose measure (in our case sales) -> click three dots to get options -> Create Calculated Field -> Tile
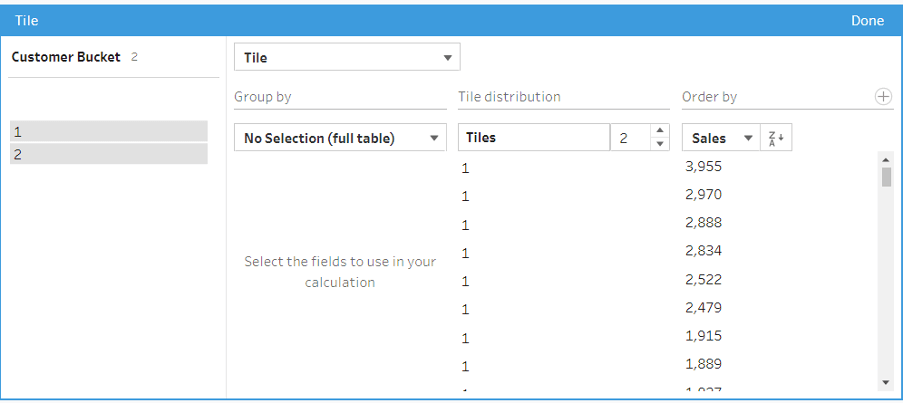
Once you click Tile option, you will get visual calculation editor. Configure following values:
Provide a name for calculation like Customer Bucket. Since we want to divide the whole dataset into buckets, we are not going to Group by (partition) by any field.
Provide the number of tiles to create (2 in our case).
Sort Sales in descending order.
Click done.
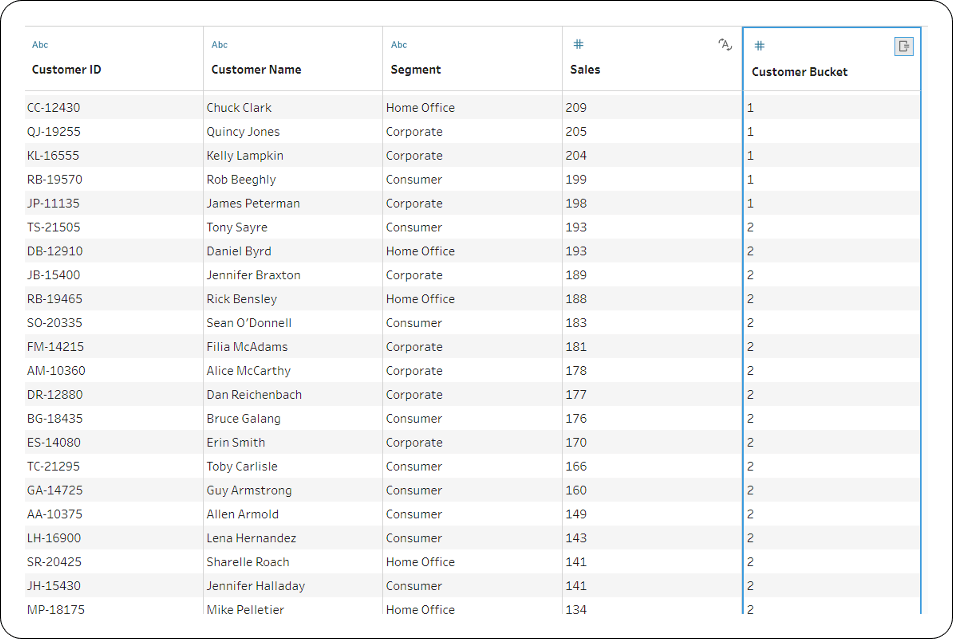
Your dataset will be divided into two buckets – Bucket 1 will contain the top 50% customers and bucket 2 contains bottom 50% customers.
Use Case 2
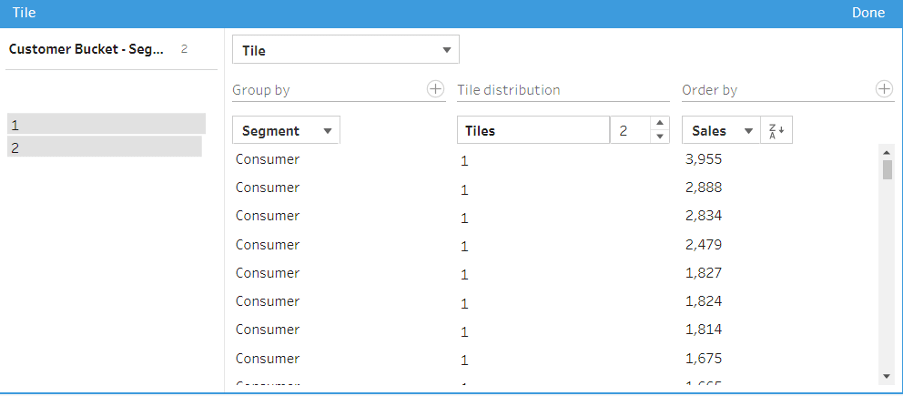
Now let’s say you also want to know the top 50% and bottom 50% customers within each segment. This will help you specifically target customers within each segment.
To achieve this, we will create another tile calculation, but this time we will group by/partition our calculation by segment.
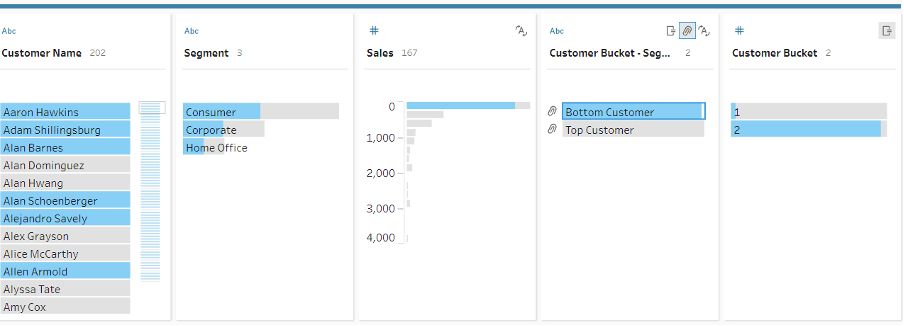
Let’s also give a meaningful name to our buckets.
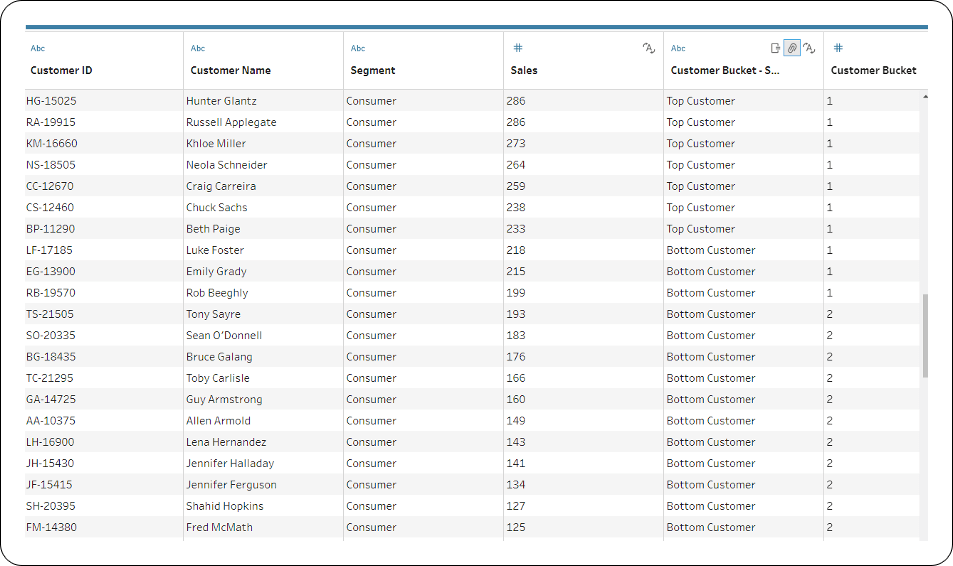
Change the data type of calculated filed from number to string and rename bucket 1 as top customer and bucket 2 as bottom customer.
We now have information on our top customers and bottom customers within each customer segment.
This insight can be used to provide discounts for bottom customers to increase sales or can be used to perform behavior analytics to find patterns in each customer bucket.
Understanding and effectively utilizing tile calculations is a crucial skill for any data analyst or business intelligence professional. By mastering this technique, you can unlock new levels of insight from your data, enabling data-driven decisions and improved business performance.