 Media Coverage
 Press Release
Boosting Performance: Mastering Tableau Workbook Optimization
Enhancing Efficiency: Advanced Techniques for Tableau Workbook Performance
Optimizing Your Analytics: Strategies for Tableau Workbook Performance Improvement

As Tableau Developer specialists, we regularly manage the issue of reports where one of the significant issues is, the time-consuming Tableau workbook. When we work with a lot of data with multiple data sources and created a dashboard that is loaded with different views and elements to control those views it’s common to have dashboard performance issues. There are various factors that affect dashboard performance such as having multiple data points on the view, the complexity of the dashboard, usage of filters, etc.
Understanding Performance Bottlenecks: Identifying Areas for Tableau Workbook Optimization
Data Source Optimization: Techniques for Improving Tableau Workbook Performance at the Source Level
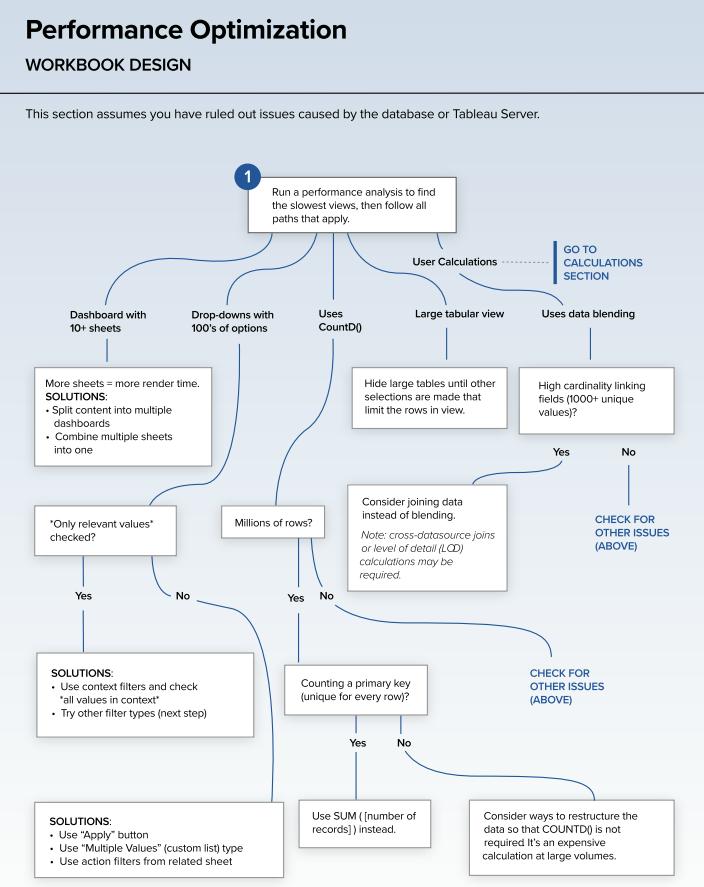
Visualization Design Best Practices: Designing Tableau Workbooks for Maximum Performance
Performance Testing and Monitoring: Tools and Tips for Evaluating Tableau Workbook Performance
Executives might want to see quick business insights and facts from reports. Indeed, a Tableau workbook report with more delivery time would be disappointing and could prompt a deficiency of interest in the report. I would like to share some tips for Tableau Workbook Performance Optimization:
Streamlining Data Sources: Best Practices for Optimizing Data Connectivity in Tableau Workbooks
Efficient Data Blending: Techniques for Optimizing Data Blending in Tableau Workbooks
Visualization Complexity: Managing Complexity for Improved Tableau Workbook Performance
Performance Monitoring: Tools and Strategies for Monitoring Tableau Workbook Performance
Implementation on Database
Use Correct Data Type: It is feasible to modify data types in Tableau (e.g., date into a string), we must follow best practices and cast the correct data type in the data source. The reason is, by recasting data type in Tableau, every query between the data source and Tableau will include the CAST function. Using best practices cast data type correctly in the data source which will reduce the load on tableau data source connectivity on a workbook.
Set indexes for Dimensions:
The data structure is one of the significant factors that affect the performance of the dashboards. Hence assigning indexes to filters and joins will sort the information stored in the database and expedite the performance of the query in the Tableau backend.
Database Joins:
INTs are always faster than strings hence joining INT datatype fields would speed up the joins. Hence Casting ID’s data type to INT in the data source would help to reduce the query execution time.
Reduce Complex Calculations:
Many times, we are required to perform a complex calculation using various LODs and functions where the Level of Detail calculation allows us to compute values based on a different granular level. However, a view requiring large and complex data with multiple granularities would be performance heavy. In this situation setting up granularity IDs on the data source side.
Referential Integrity:
Many times, we see multiple joins causing performance issues. When we have multiple joins, but the query requires data from a single table, we can use one of the Tableau backend functionalities called “Referential Integrity” which culls unnecessary joins. However, it would work if referential integrity on the database level has been set correctly. Setting this in the database using foreign keys is the best practice. This is more reliable with inner joins.
Implementation on Tableau Workbook
Use Aggregation:
It is critical to check if data is aggregated on required granularity as more granular data will slow down the performance of the workbook. Executing queries for transactional level data will be more time-consuming. Use LODs cleverly for different levels of granularities.
Use filters:
- Extract and Data Source Filters: Tableau has a variety of filters, using the right filters is a significant thing to be considered. Sometimes we have insignificant data which is not used in the workbook. This additional data would only affect the performance as each time tableau executes the query it has to look through all unnecessary data every time. Using extract and data source filters we can minimize our dataset and keep only fields that are relevant to the analysis. We can save the tableau workbook in. hyper or .tde formats. This is the optimal way unless we need real-time / zero-latency data and have the associated infrastructure to support that. The more data Tableau has to go through, the longer it takes therefore while extracting hide all unused fields.
- Context Filters: Context filters are applied after extract and data source filter but before rest filters (dimension filters, measure filters, and table calculation filters) hence context filters can greatly influence the performance. Applying context filters would not be a good practice as after applying context filters it creates a new dataset which is a time-consuming process. This happens before any calculations are computed, or other filters are applied. However, this filter would be an ideal choice if they are able to reduce the data size to at least 1/10th of the original size because in many cases the additional query execution time will offset the performance improvement.
- Evaluation of Filters: Filter affects the performance dramatically hence applying only necessary and right filters is very important. Additional filters will cause to extra query computation time. Abstain the use of “include only relevant values” as this also required extra computation power and makes the workbook slower.
Shape up your calculations:
- First possible thing we could do to improvise calculation is to avoid COUNTD as it is one of the slowest aggregations in Tableau as each time it will have to find distinct values. Try to use alternative methods provided in this article (multiple alternatives to COUNTD).
- Secondly, avoid nested calculations like one statement calculation under another as it will make the calculation more complex. because a new query is run every time a calculated field is referenced so. Try to divide complex calculations into simpler ones. Use numeric and Boolean values instead of strings as numbers and Booleans are faster than string values.
- When testing for multiple conditions in a calculation try using ELSEIF instead of ELSE IF as this will keep the evaluation in the same statement and would no move to a new nested statement. It is additionally great to ensure that the tests come aligned correctly, with the most probable result. If 90% of the dataset is case X and just 10% case Y, then, at that point, test for case X preceding case Y.
Use of Containers: Avoid using floating containers and use tile ones as floating containers take higher computation time as compared to tiled containers.
Enhance Visualization: Additional worksheets can also impact the performance as each worksheet will execute its own query. Hence limit the number of worksheets by spreading them across the different dashboards
Highly detailed graphs are comparatively slower, as the number of marks on the view impacts the performance of the workbook significantly. Try to limit marks by aggregating, filtering, removing extra files from the marks shelf, and splitting visualization into multiple worksheets. This will save the rending time of the Tableau workbook.