Mastering Tableau Sorting with Multiple Dimensions
Sorting Strategies for Complex Data in Tableau
Enhance Your Data Analysis: Advanced Sorting Techniques in Tableau
Introduction to Tableau Sorting:
You can draw attention to the information you are trying to convey by switching the sort order of a visualization. Whether you’re utilizing numeric data (such as sales figures) or text data (such as state names), you can arrange your graphics however you like.
Sorting the measures is crucial when creating a visualization since it makes it easier for us to understand the data being shown. When there are multiple dimensions in the view, nested sorting is necessary.
Understanding Sorting Challenges with Multiple Dimensions in Tableau
Sorting Techniques for Hierarchical and Categorical Data in Tableau
Leveraging Tableau’s Sorting Options for Effective Visualization
Best Practices for Sorting Data in Tableau Dashboards
Sorting Hierarchical Data: Techniques and Best Practices
Custom Sorting in Tableau: Tips and Tricks for Effective Data Organization
Sorting Categorical Data: Strategies for Improved Visualization
Dynamic Sorting: Creating Interactive Sorting Controls in Tableau
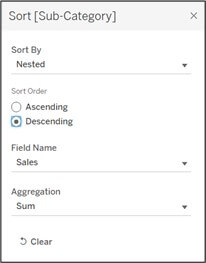
You can choose the field whose value will be used to decide the sort order using nested. The field does not need to be used in the visualization. For the sorting field, you can also choose an aggregation. Depending on the field type, different aggregation options are possible.
Listed below are the techniques for sorting:
- Sorting on a combined field
- Rank function
- Nested Sort
Sorting on a combined field:
1. Drag the region and sub-category to rows and sales to columns.
2. Let’s create a combined field with Region and Sub-Category, by clicking Region and Sub-Category with Ctrl held -> Right click -> Create -> Combined Field
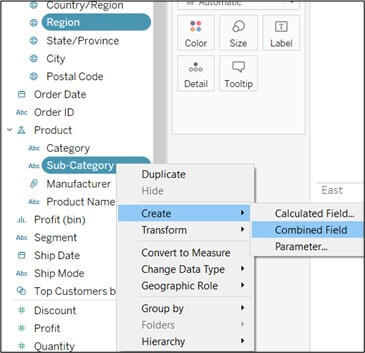
3. Drag this before the Category on the row shelf.
4. Right-click on the combined field, select sort by Field then sort Descending by sales at the aggregation level of Sum.
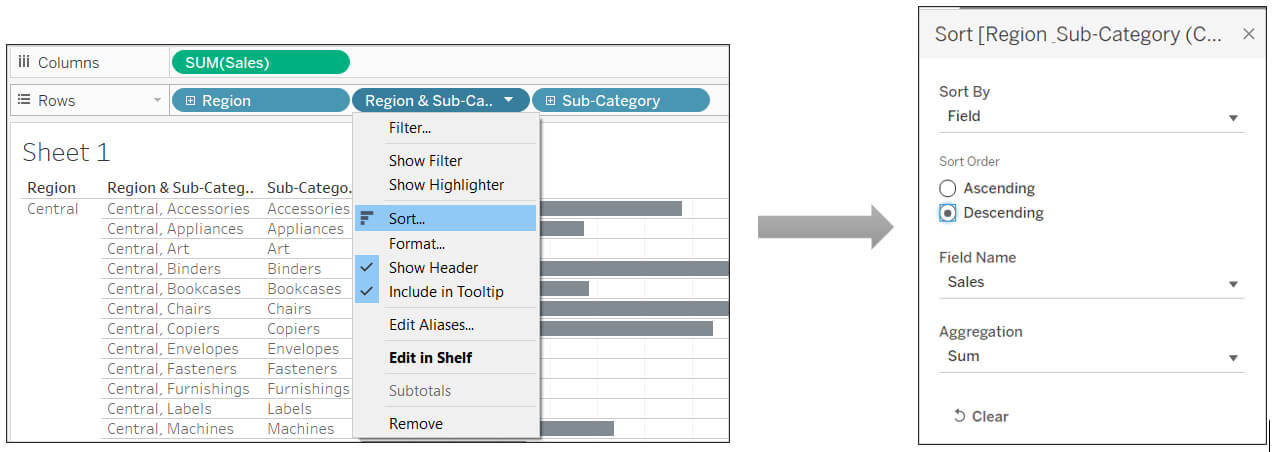
5. Right-click on the combined field (Region & Sub-Category (Combined)) and uncheck the Show Header.
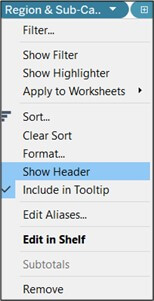
6 . Now you have a bar chart that is sorted by two dimensions.
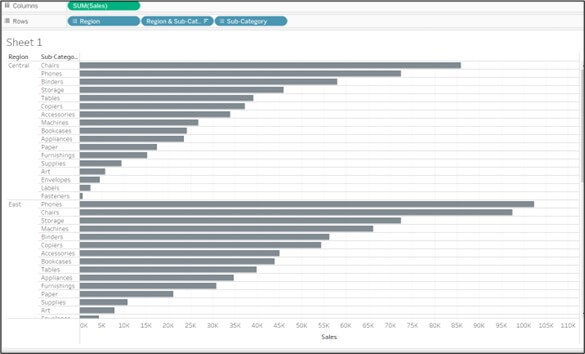
Rank Function:
1. Drag the region and sub-category to rows and Sales to columns and bring the Sales to the label on the marks card.
2. Right-click on the Sales on the marks card and select quick table calculation -> Rank.
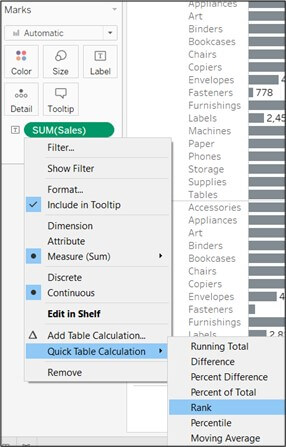
3. Right-click on Sales and select compute using the Pane (Down).
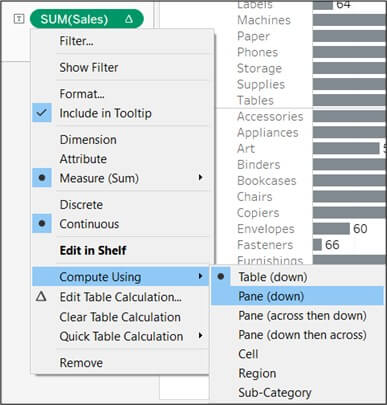
4. Drag the Sales to the row self and right-click -> Discrete.
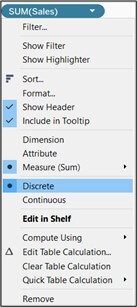
5. Move the Sales before the Sub-Category and right-click on Sales and uncheck Show Header.
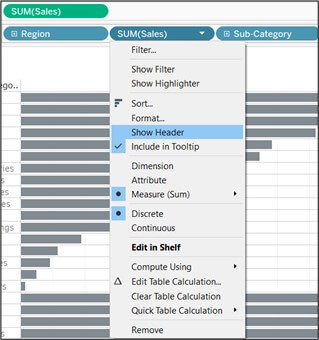
6. In this example, it is sorted by Region and Sub-Category. Now you have a bar chart that is sorted by two dimensions. This allows some nice interactivity.
Nested Sort:
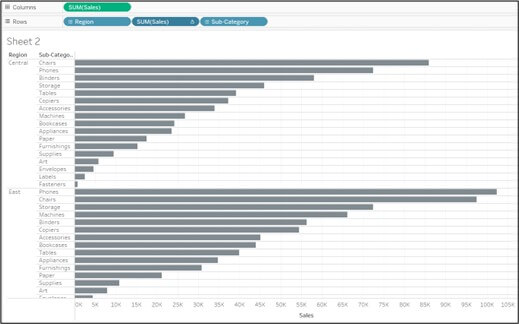
1. Drag the region and sub-category to rows and sales to columns
2. Right-click on the Sub-Category and select sort.
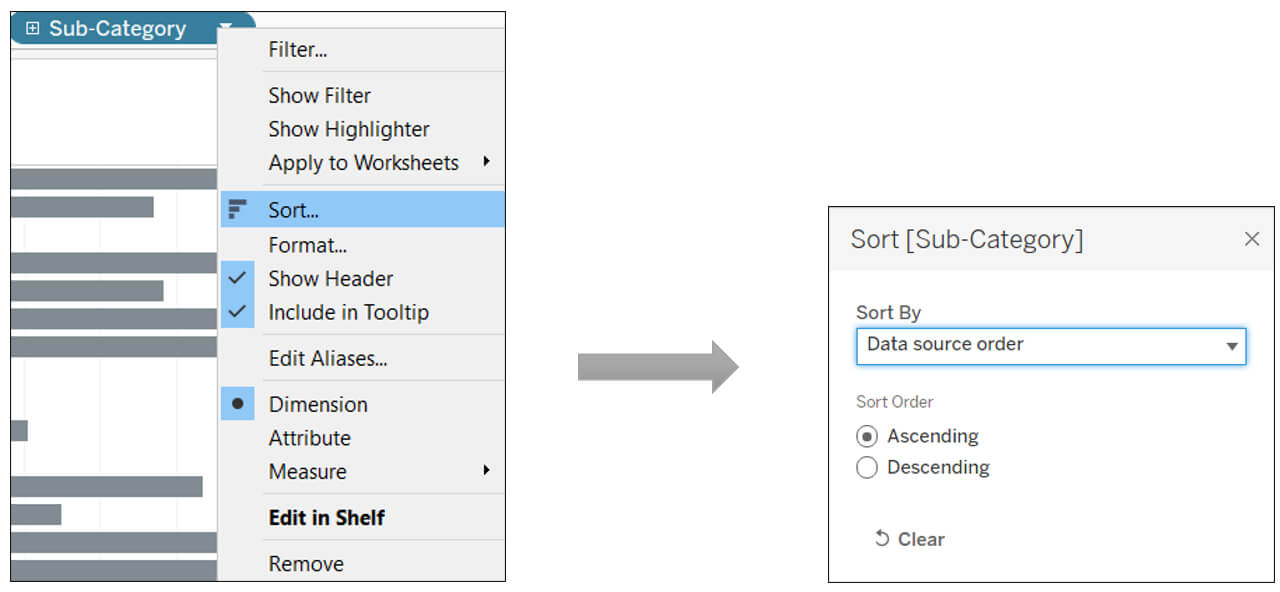
3. Change Sort by to Nested and Select sort order Descending by sales at the aggregation level of Sum.
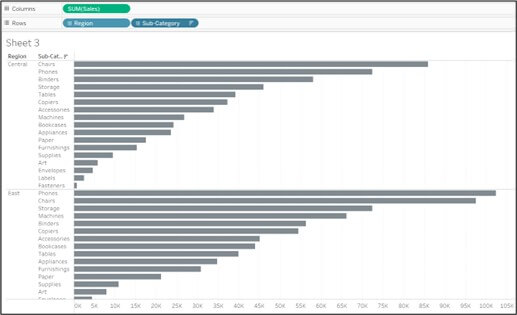
4. Once all the steps are completed, we’ll get the desired result as shown below.
Conclusion
In conclusion, I have covered the basics of the Tableau Sort Function in this article. The various scenarios in which we can use the Tableau Sort Function have been covered.


 Media Coverage
 Press Release
