How to Create Effective Paginated Reports in Power BI
Power BI Paginated Reports: A Comprehensive Guide
Best Practices for Designing Paginated Reports in Power BI
What Are Paginated Reports in Power BI?
Step-by-Step Process for Creating Paginated Reports
Key Features of Power BI Paginated Reports
Optimizing Reports for Print and Large Data Sets
Understanding Paginated Reporting in Power BI
Designing Print-Ready Reports with Power BI
Tips for Managing Large Data in Paginated Reports
Enhancing Data Visualization in Paginated Reports
For a Modern BI tool, Power BI is a solid choice offering interactive dashboards and dynamic reports that cater to a wide range of analytical needs. However, there are instances – like when you have to display a large amount of data in a structured, multi-page format in print – only a paginated report will do.
In this step-by-step guide, we will show you how to create paginated reports within Power BI. From understanding the prerequisites to mastering the design process, this blog will equip you with the knowledge necessary to make full use of this feature.
What is a Paginated Report?
Reports with pagination are intended to be shared or printed as PDFs. They allow for precise formatting, making them ideal for detailed reports that span multiple pages. Paginated reports are meant for more formal, organized reporting, compared to regular Power BI reports, which are designed for interactive data analysis.
Prerequisites for Creating Paginated Reports in Power BI
- Power BI Service: You need access to the Power BI service to publish and manage paginated reports.
- Power BI Premium or Premium Per User (PPU): Paginated reports require a Power BI Premium capacity or a Premium Per User license.
- Power BI Report Builder: This tool is essential for creating paginated reports.
Step 1
Install and Set Up Power BI Report Builder
Go to the Power BI Report Builder page and download the tool. This is what the Power BI Report Builder Download page looks like.

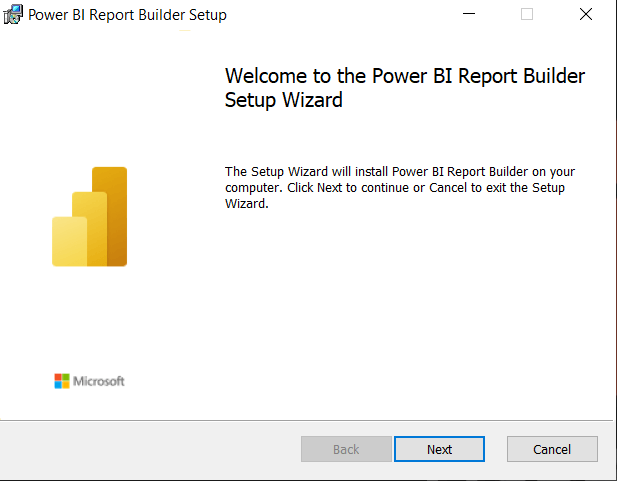
Start the installation as soon as the download is finished. Here’s a screenshot of the setup wizard to begin the installation process.
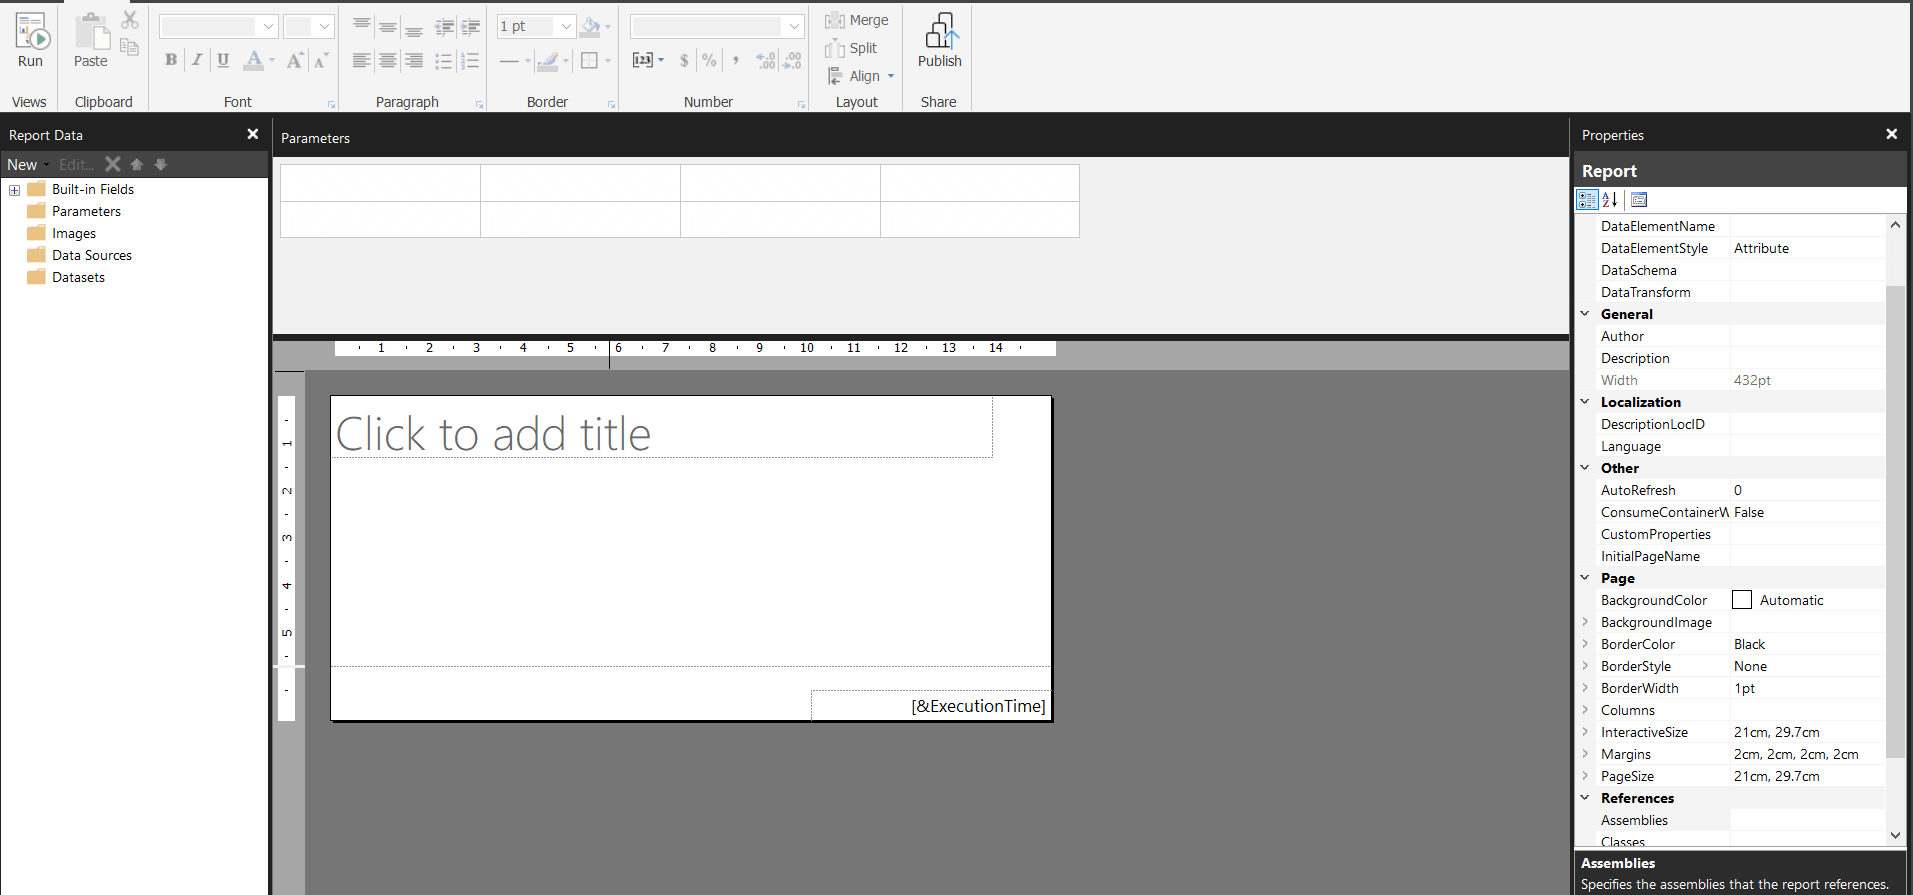
After installation, open Power BI Report Builder. The home screen of Power BI Report Builder looks like this.
Step 2
Create a Paginated Report
1. Connect to a Data Source:
- Open Power BI Report Builder.
- Go to “File” > “New” > “Blank Report”
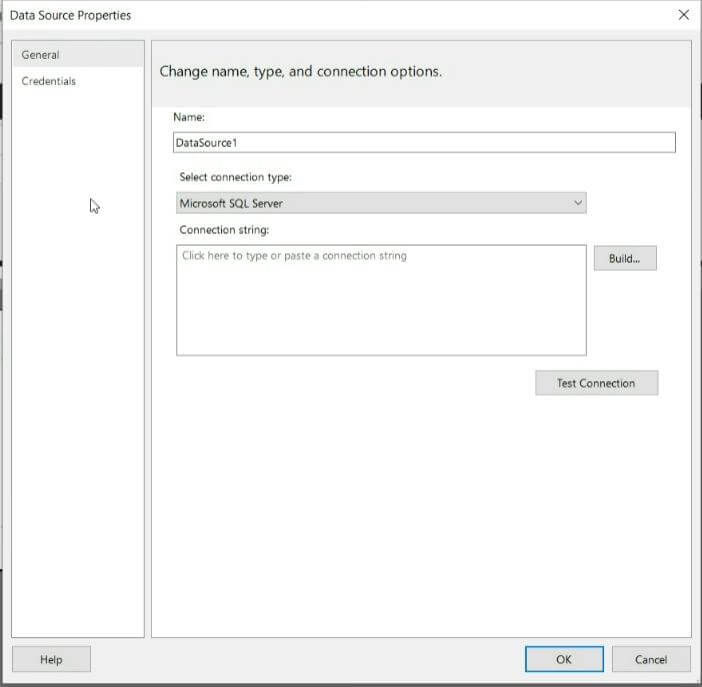
- Select “Data Sources” from the Report Data pane and choose “Add Data Source”.
Here’s a screenshot of adding a Data Source.
2. Create Datasets
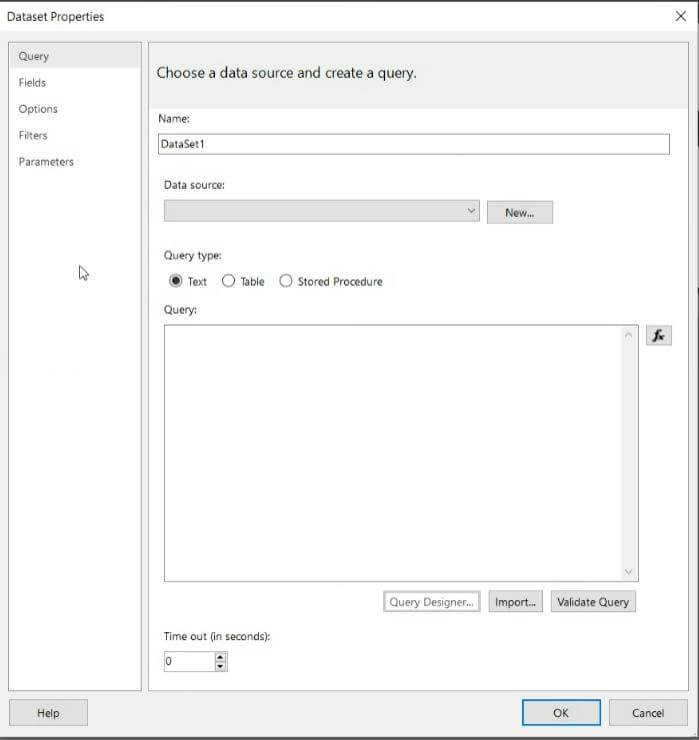
- After connecting to a data source, right-click on “Datasets” and choose “Add Dataset”.
- Define your dataset by writing a query or using the query designer.
Here’s a shot of the starting screen when creating a dataset.
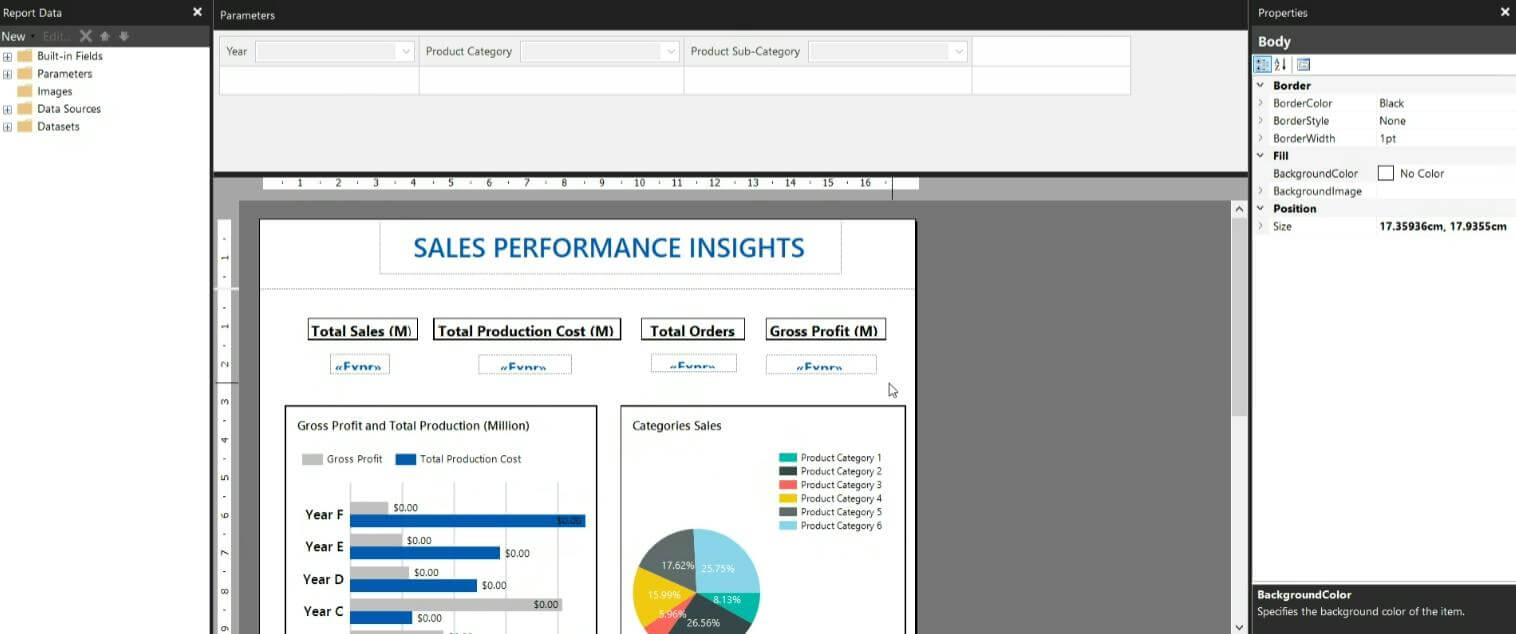
3. Design the Report:
- Drag a Table, Matrix, or List onto the report canvas from the Toolbox pane.
- Populate the report with fields from your dataset.
- Adjust the layout, add headers, footers, and format the report as needed.
A sample shot of the report designing process.
4. Set Up Pagination:
- Right-click on the table or data region, select “Properties”, and configure pagination settings.
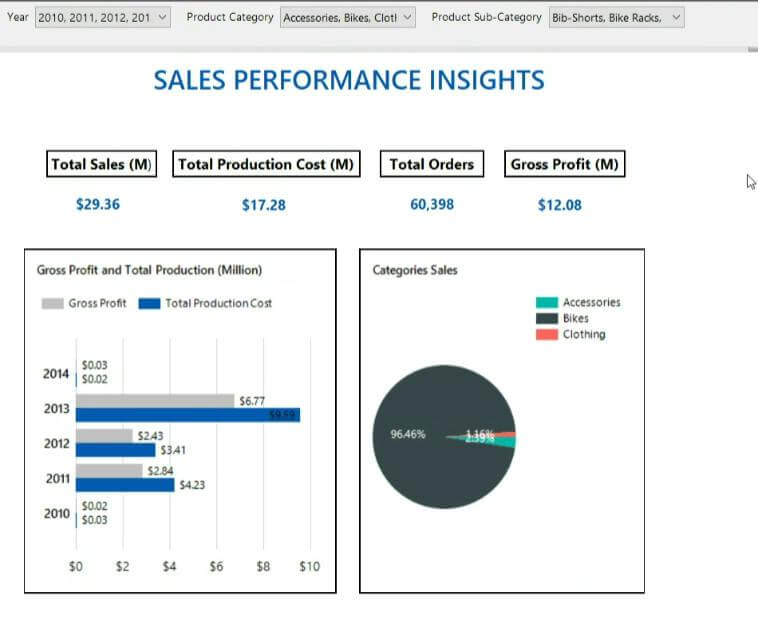
5. Preview the Report:
- Click “Run” to preview your report and ensure it is paginated correctly.
A sample report preview.
Step 3
Publish the Paginated Report to Power BI Service
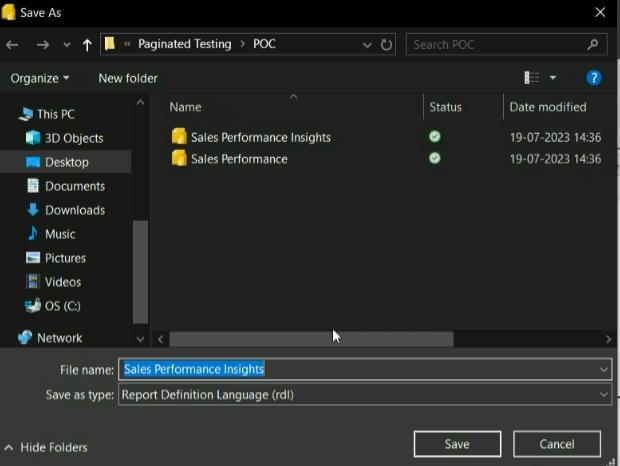
6. Save the Report:
- Save your report as an .rdl file.
Saving the Report
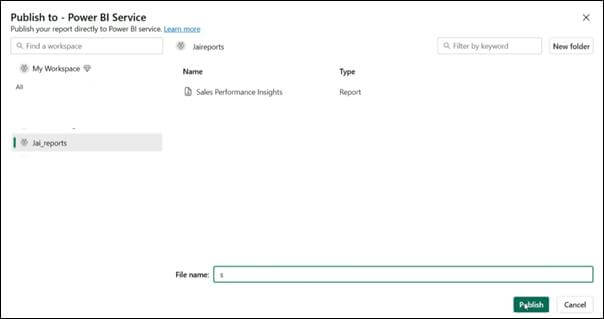
- Upload to Power BI Service:
- Go to Power BI Service and navigate to your workspace with Premium Capacity.
- Click on “New” > “Paginated Report” and upload the .rdl file
Uploading the Paginated Report
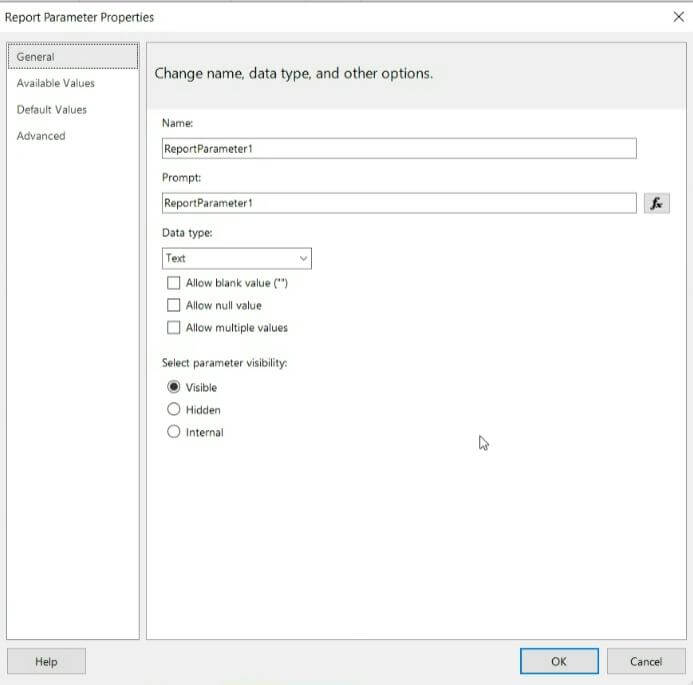
- Set Up Parameters (Optional):
- If your report includes parameters, configure them in the Power BI Service.
Parameter Configuration
This is what parameter setup screen looks like.
Conclusion
Paginated reports in Power BI offer a compelling solution for users looking for a structured, print-ready format. Their ability to handle large datasets with precision combined with customizable layouts, make paginated reports ideal for sharing with stakeholders or preserving historical data. We hope that the steps detailed in the blog are easy enough to follow. By leveraging the capabilities of paginated reports, you can elevate your data storytelling and deliver insights that are both informative and visually appealing.
Happy reporting!


