Visualizing Movement with OD Maps in Tableau
Best Practices for Mapping Spatial Data in Tableau
Enhancing Geospatial Insights with Tableau
Understanding Origin-Destination Mapping in Tableau
Preparing Data for OD Maps in Tableau
Using Paths to Connect Origin and Destination Points
Customizing Your OD Map for Better Visualization
Importing and Cleaning Data for OD Mapping
Configuring Tableau’s Path Function for Flow Maps
Optimizing Performance for Large Datasets in OD Maps
Adding Interactive Filters to Your OD Visualization
The Origin-Destination (O-D) map is a geographic visualization tool used to depict the paths or connections between starting points (origins) and ending points (destinations). This map helps visualize and analyze the movement of people, goods, or services between different locations. By plotting geographic coordinates and linking them with lines, O-D maps provide a clear picture of spatial flow, helping to analyze traffic, optimize supply chains, or understand migration routes.
Steps to Create Origin Destination Map
1. Data Preparation: For this type of map, users must ensure the dataset includes the longitude and latitude coordinates for both the Origin and Destination routes.
2. Data Connection: Launch Tableau Desktop and link it to your dataset.
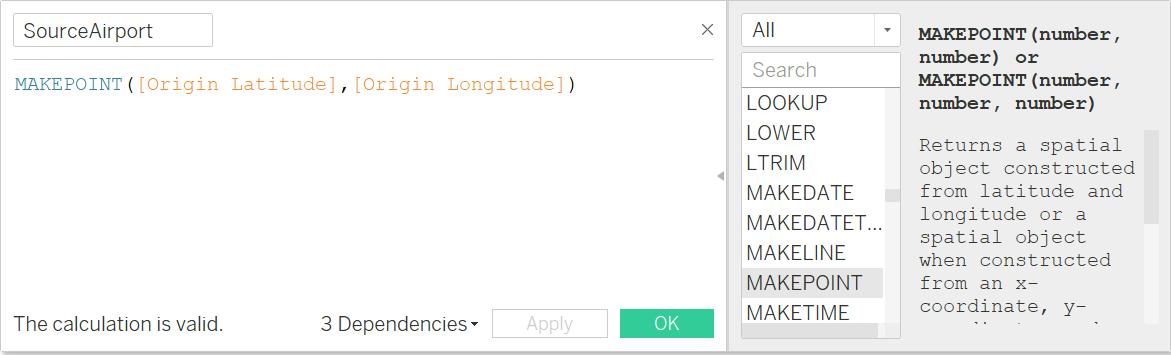
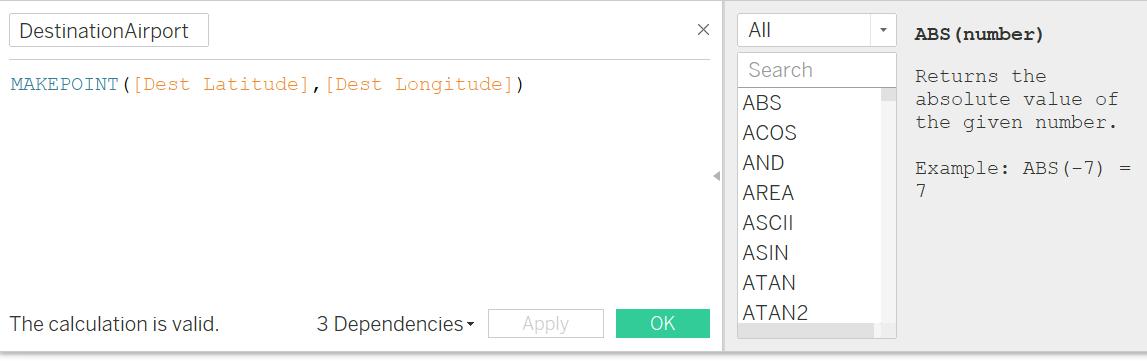
3. Create Calculated Fields of location points for both the Origin Airport and Destination Airport
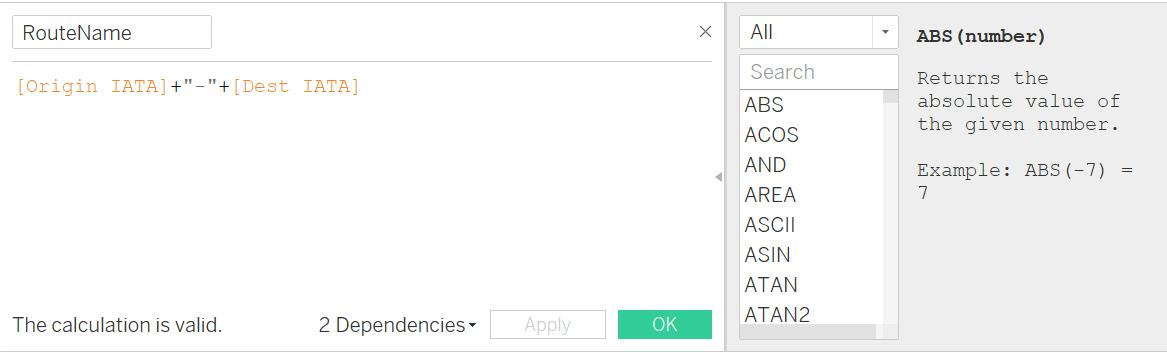
I. Next step is to Create Calculated Fields for Routes & Route Name
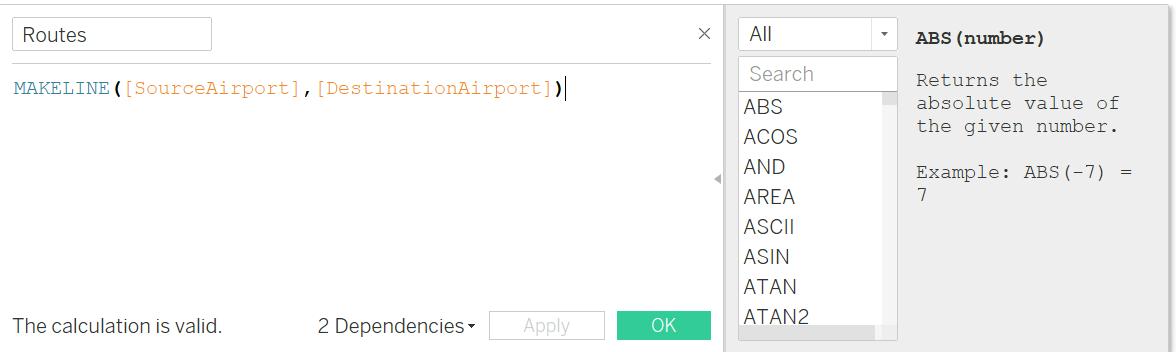
II. Route Name:
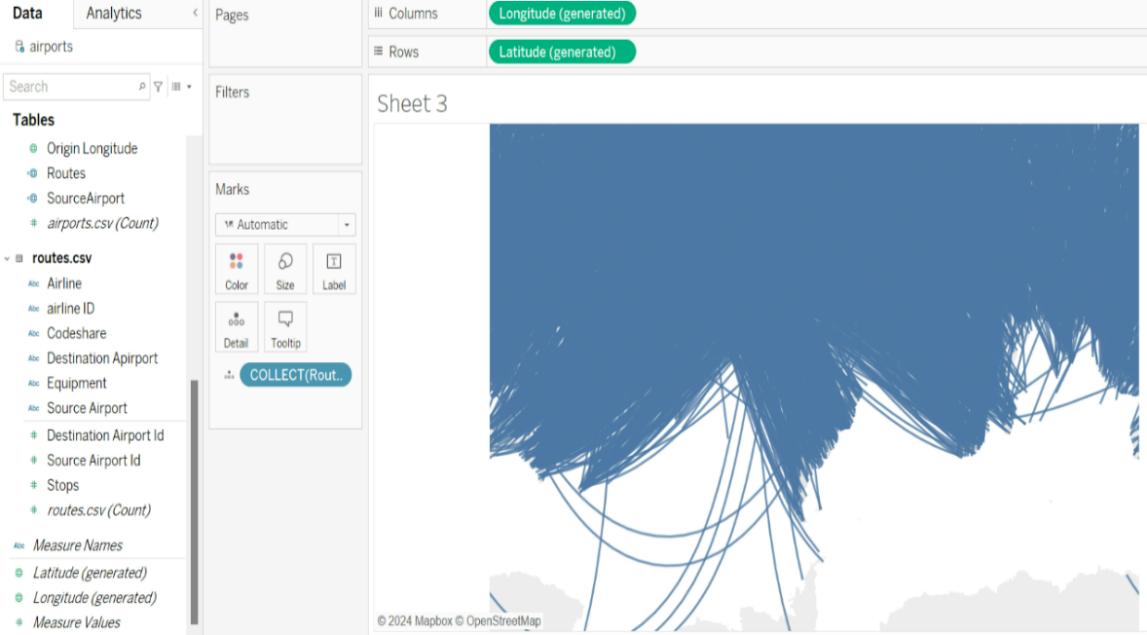
- Drag the Route calculated field into the Details pane on the Marks card.
The map displayed below will now be visible to users:
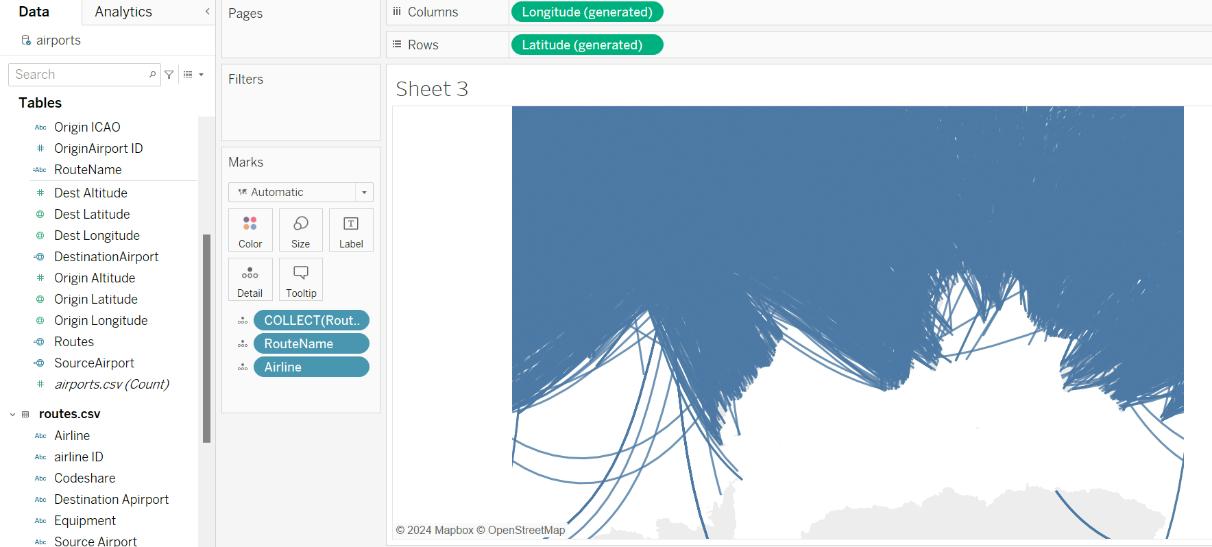
- Since each route is operated by multiple airlines, we need to ensure this is reflected on the map. To do this, we will add the Route Name calculated field and the Airline field to the Details pane of the Marks card.
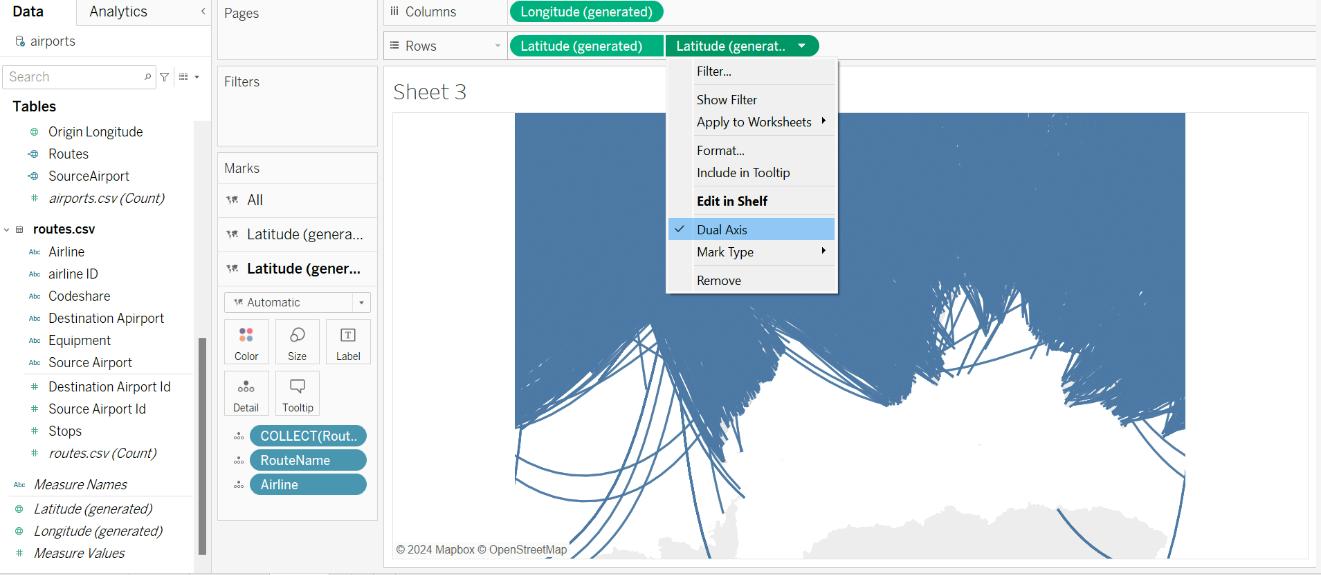
- To display both the Origin and Destination routes on a single map, duplicate the Latitude (generated) field in the Rows shelf and place it there again
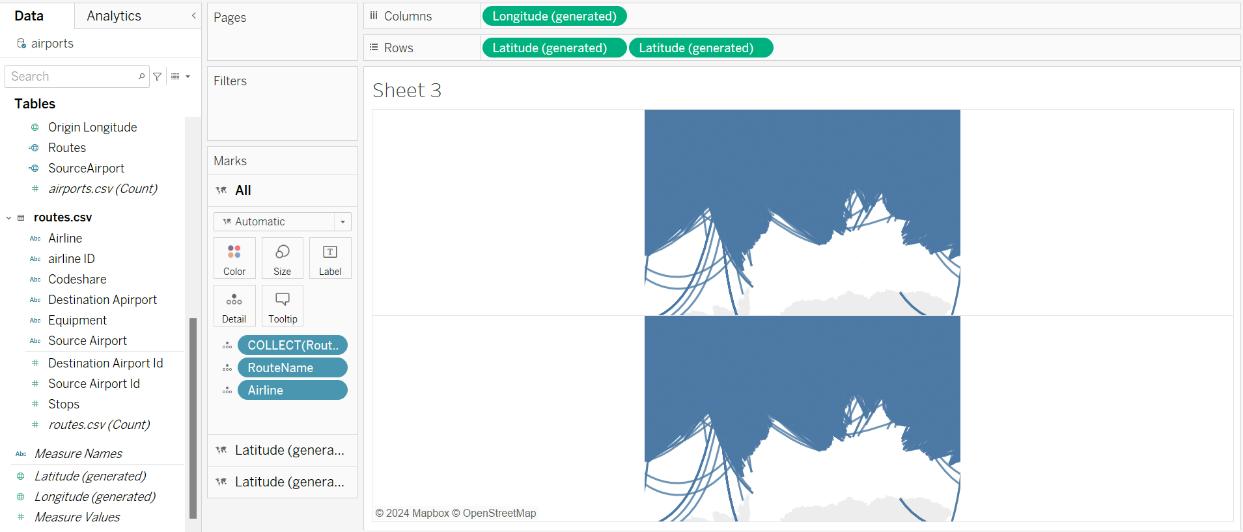
- Now, right-click on the Latitude (generated) field in the rows shelf and select Dual-Axis.
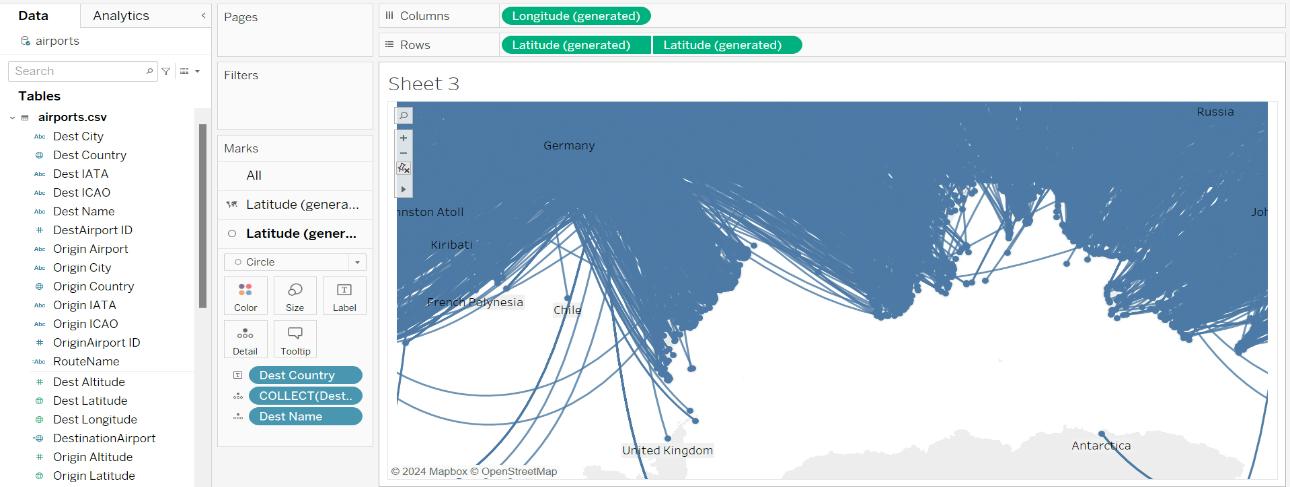
- As we can see, two latitude fields have been generated in the Marks card. Select the second latitude, then add the Destination Country field to the Label, Destination Name field to the Detail, and the Destination Airport Calculated field to the Detail. Switch the mark type from Automatic to Circle.
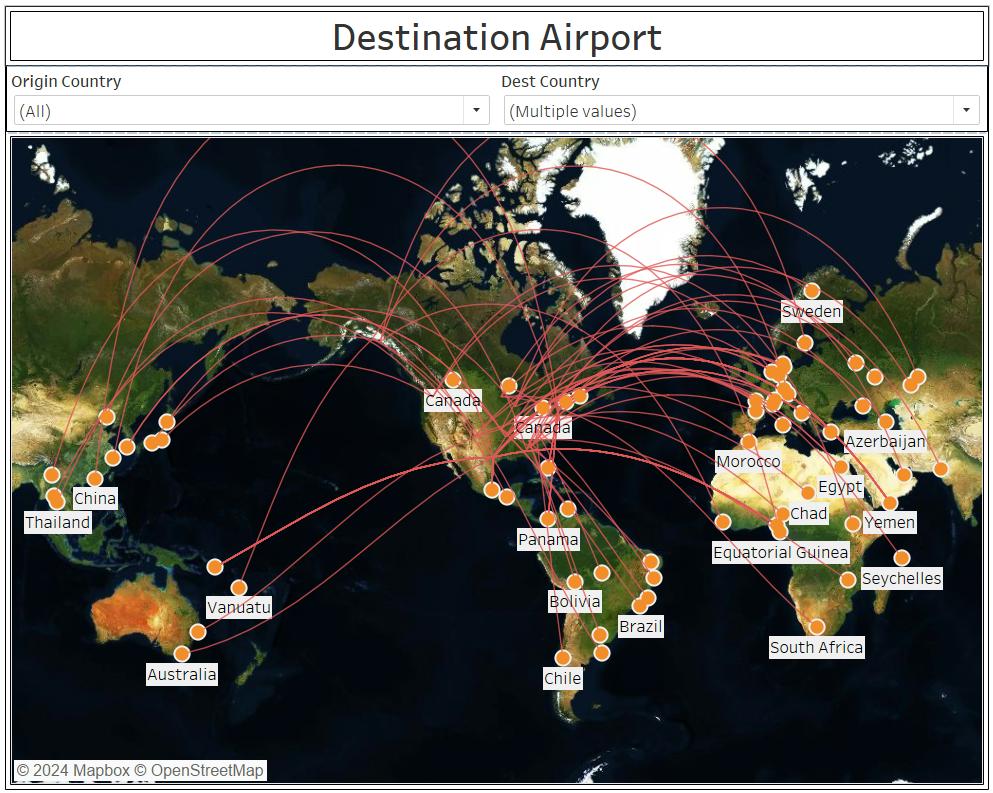
Filters
- Next, include the Origin Country, Origin City, and Destination Country fields in the Filters Pane.
- Users can customize the map’s view, color, and size of the spark according to their preferences.
The final map will resemble the one below, featuring a satellite background.
Benefits of Origin-Destination Map
Real-Time Data Visualization
When linked to real-time data sources, O-D maps offer current insights into movement patterns, making them particularly valuable in sectors such as transportation and logistics.
Enhanced Insights
Mapping origins and destinations allows users to gain insights into travel behaviours, customer flows, and logistical routes, informing strategic decision-making.
Comparative Analysis
Users can generate multiple O-D maps to compare various scenarios, such as flows before and after interventions, enhancing their understanding of the impacts of changes.
Limitations
Data Complexity
O-D maps necessitate detailed datasets that include origins, destinations, and relevant metrics (such as volume or distance), making data preparation a complex process.
Scalability
With large datasets, O-D maps can become cluttered and challenging to interpret, particularly when many points are located close together.
Time Dynamics
Static O-D maps may not effectively convey changes over time unless explicitly animated or compared in a time-series analysis.
Crafting an Origin-Destination map in Tableau unlocks a powerful way to visualize spatial relationships and movement patterns with precision. Whether you’re analyzing flight routes, optimizing logistics, or studying migration trends, this step-by-step approach equips you with the tools to transform raw geographic data into actionable insights.
The beauty of Tableau lies in its flexibility which lets you customize your map, tweak the filters, and layer in additional details to suit your unique use case. While challenges like data complexity or scalability may arise, the ability to distil intricate flows into a clear, compelling visual makes the effort worthwhile.