
Leveraging AI for Customer Sentiment Analysis
Advanced Sentiment Analysis with Microsoft Fabric
Turning Customer Feedback into Insights: Part Two
Advanced Sentiment Analysis Techniques in MS Fabric
Building Machine Learning Models for Sentiment Analysis
Integrating AI for Deeper Customer Insights
Best Practices for Sentiment Data Analysis
Exploring Machine Learning Models in Sentiment Analysis
Configuring MS Fabric for AI-Driven Sentiment Analysis
Visualizing Advanced Sentiment Trends
Real-World Applications of Sentiment Analysis
Sentiment Analysis with MS Fabric: Transforming Customer Reviews – Part One
(Continued…)
3. Performing Sentiment Analysis with Synapse Data Science
Once the data was prepared, we utilized Synapse Data Science to apply machine learning techniques for sentiment analysis. Instead of training a custom model, we took advantage of the built-in Synapse ML Services for fast and efficient sentiment classification.
Step 1
This step retrieves the cleaned data from the Delta table `lakehouse_sentiment_analysis. cleaned_data` using Spark SQL and stores it in a Dataframe `df`. The `display(df)` command then shows the contents of the Dataframe, allowing you to visualize the data before adding a sentiment analysis column. This is the first step in preparing the data for sentiment analysis.

Step 2
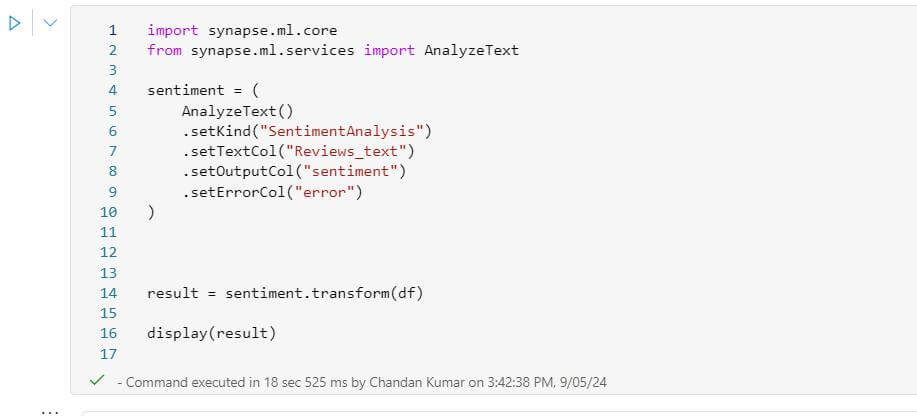
This step performs sentiment analysis on the “Reviews_text” column in the Dataframe `df` using Synapse ML’s `AnalyzeText` service. It sets the analysis type to sentiment analysis, input column to “Reviews_text”, output column to “sentiment”, and error column to “error”. The `transform` method applies the analysis, generating a new Dataframe `result` with the added “sentiment” column, which is then displayed. This adds a sentiment score to each review, indicating whether it’s positive, negative, or neutral.
Step 3
This step refines the sentiment analysis output by selecting the “sentiment” score from the nested “documents” column and dropping unnecessary columns (“error” and “response”). The resulting Dataframe `df_sentiment_final` contains the original data with an added “sentiment” column, showing the sentiment score for each review, and is then displayed.

Step 4
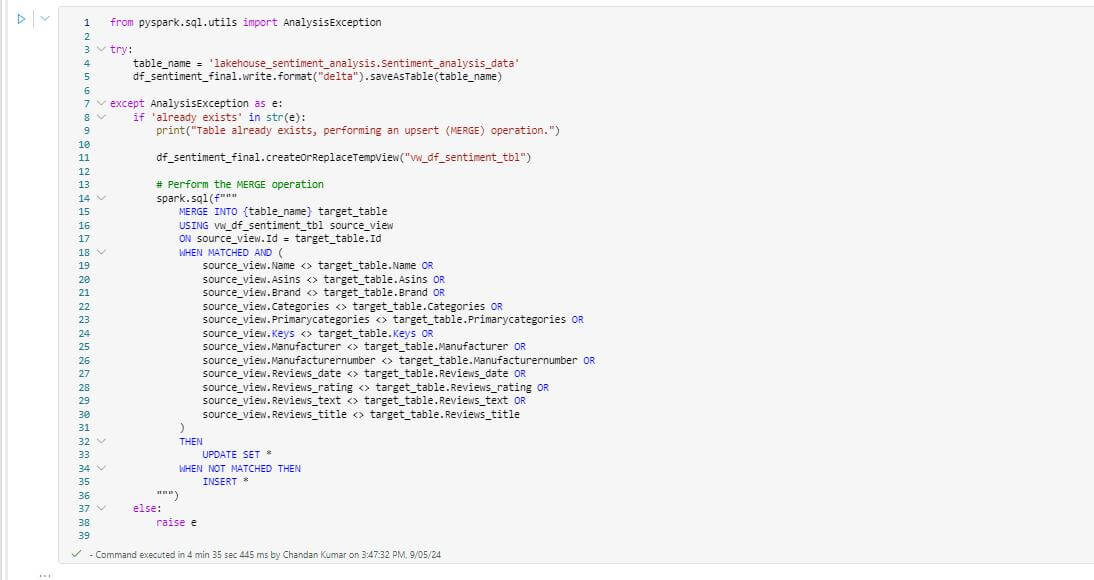
This step is similar to step 4 of Connecting and Preparing Data with Synapse Data Engineering for Sentiment Analysis explained above. Here the only change is in Dataframe and delta table.
Utilizing Lakehouse for Unified Storage and Analytics
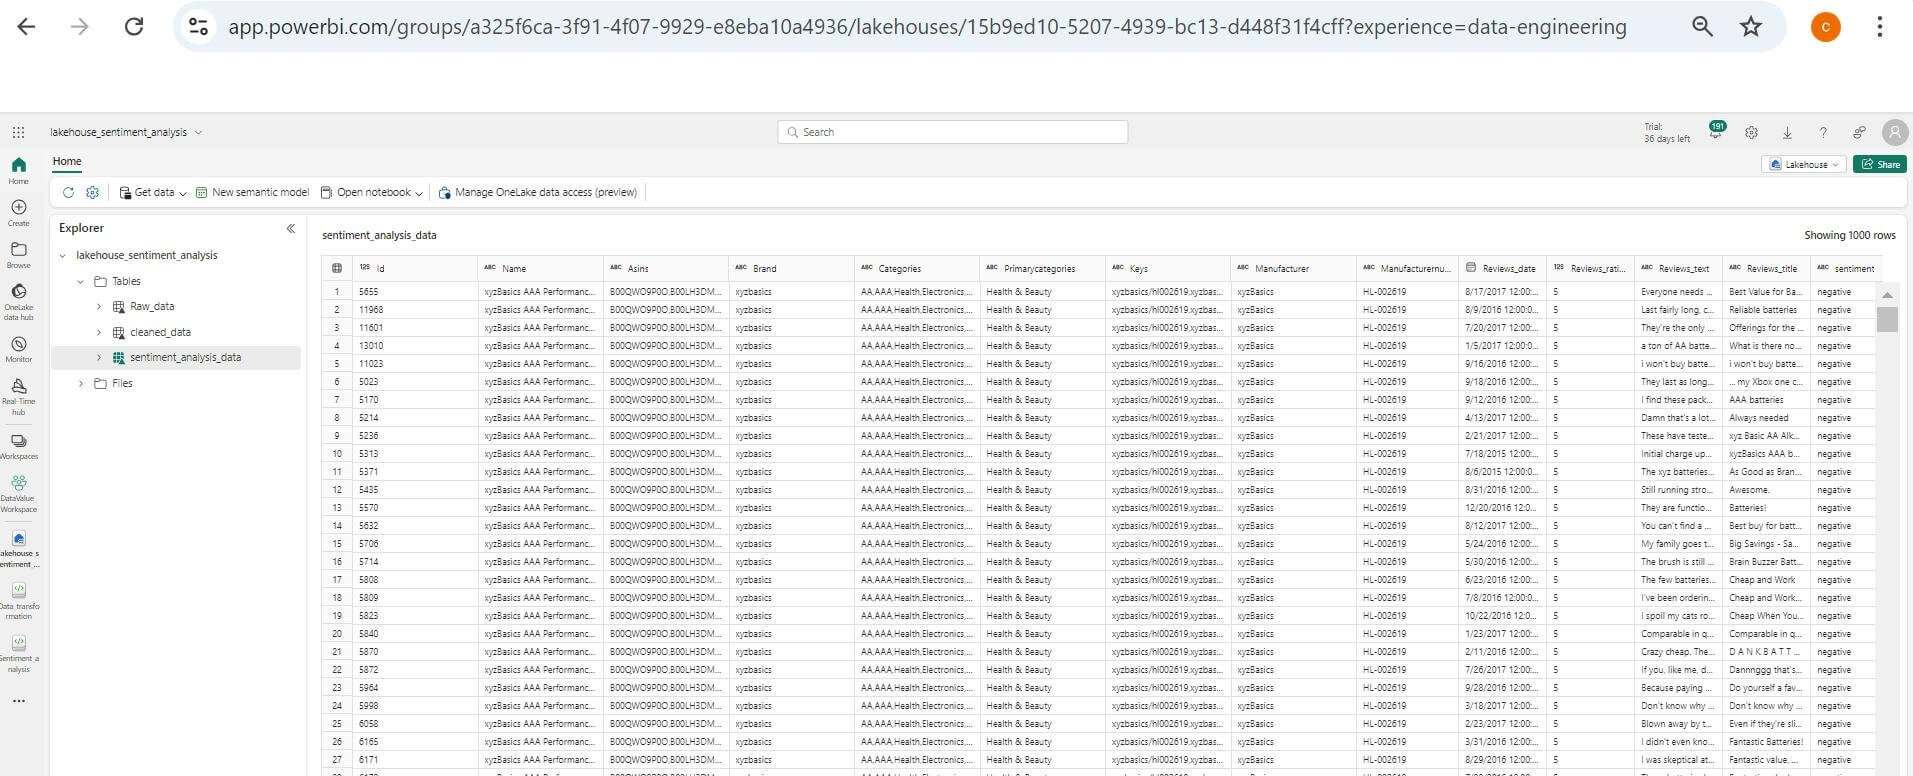
A unified storage platform, to store raw data, processed data, and models. This provided seamless integration between data storage and machine learning processes, making it easier to manage and scale.
Automating Workflows with Data Pipelines
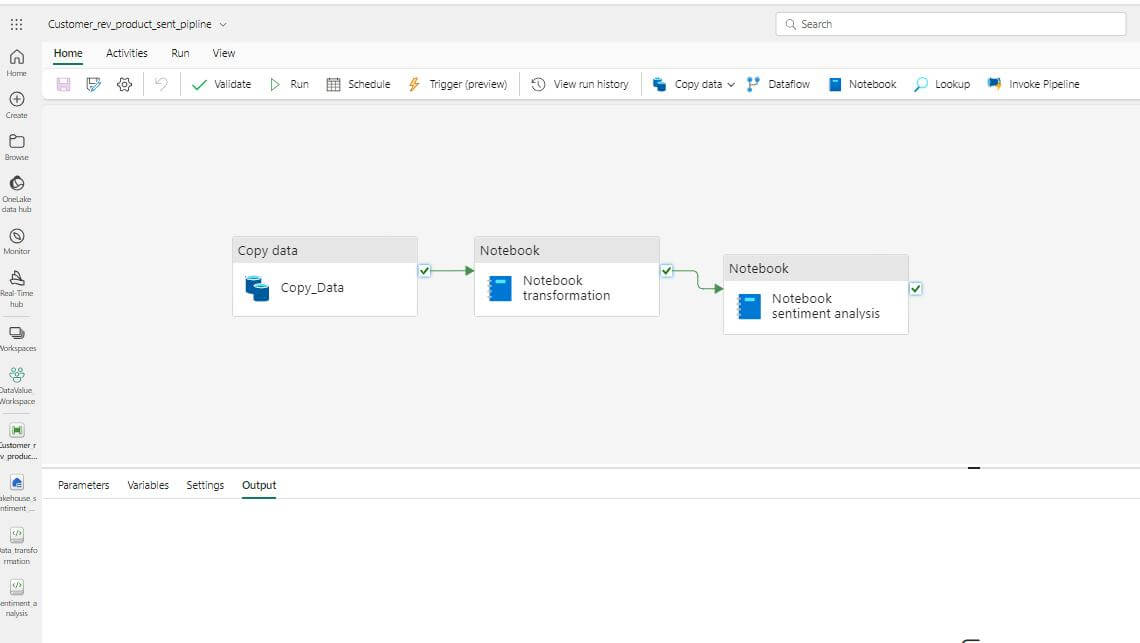
We automated the entire process using Data Pipelines within Microsoft Fabric. The pipelines ensured that new customer review data could be regularly ingested, transformed, analyzed, and updated in real-time.
This included:
- Data Ingestion Pipelines: Automating the collection and loading of new customer reviews into the Lakehouse.
- Transformation Pipelines: Triggering the necessary transformations and analysis workflows when new data arrives.
Visualization and Insights Using Power BI
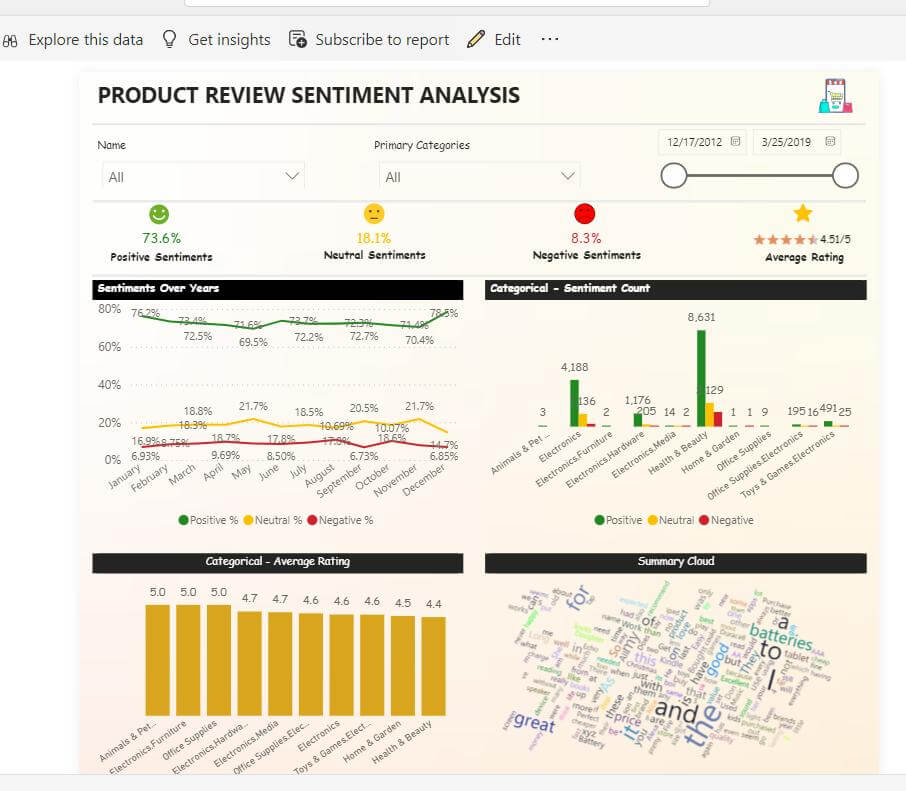
To bring the results to life, we used Power BI to create an intuitive dashboard that presents sentiment analysis results. The dashboard enabled the team to visualize the distribution of positive, negative, and neutral reviews and filter insights by product categories, time periods, and name, track sentiment trends and identify areas for improvement.
Conclusion
In conclusion, by leveraging the powerful features of Microsoft Fabric, from Synapse Data Engineering and Data Science to the Lakehouse and automated Data Pipelines, we successfully performed sentiment analysis on customer reviews. The Power BI dashboard provided actionable insights, enabling the business to make data-driven decisions and enhance product offerings based on customer feedback. This PoC demonstrates how Microsoft Fabric can streamline the data-to-insight journey for any business looking to leverage sentiment analysis in real time.
Click here for Part One


 Media Coverage
 Press Release

