Transforming Customer Reviews into Insights
Leveraging Microsoft Fabric for Sentiment Analysis
Unveiling Customer Sentiments with MS Fabric
Understanding Sentiment Analysis in Customer Reviews
Why Use Microsoft Fabric for Sentiment Analysis?
Steps to Prepare Data for Sentiment Analysis
Visualizing Sentiment Data for Actionable Insights
Basics of Sentiment Analysis Explained
Setting Up Microsoft Fabric for Data Analytics
Tools and Techniques for Sentiment Visualization
Benefits of Sentiment Analysis for Businesses
Microsoft Fabric is a comprehensive data analytics platform that simplifies the process of extracting insights from vast datasets. It brings together various tools and services, such as data engineering, data science, real-time analytics, and business intelligence, into a unified environment. With Fabric, organizations can streamline their data pipelines, perform advanced data analysis, and create interactive visualizations to make informed decisions. Its intuitive interface and powerful capabilities make it an asset for businesses of all sizes.
Introduction
In today’s competitive landscape, understanding customer sentiment is essential for businesses to thrive. Sentiment analysis enables companies to gather valuable insights from customer feedback and improve products, services, and overall customer experience. With the rise of powerful cloud platforms like Microsoft Fabric, it’s now easier than ever to integrate and analyze vast amounts of data across multiple services.
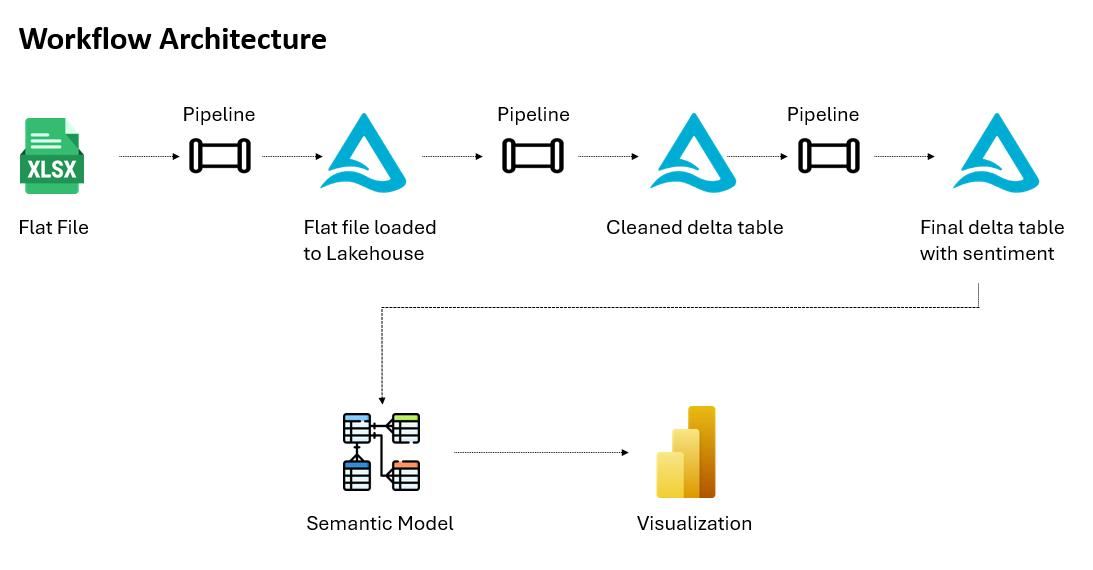
In this proof-of-concept (POC) project, we utilized Microsoft Fabric’s comprehensive data and AI services to perform sentiment analysis on product reviews. By connecting data stored in a flat file to Synapse Data Engineering and Synapse Data Science and leveraging the power of the Lakehouse architecture and pipelines, we visualized the results in a Power BI dashboard. This blog outlines the end-to-end process, showcasing how various components of Microsoft Fabric come together to derive actionable insights from customer reviews.
Business Benefits
When it comes to customer sentiment, companies are often flooded with feedback and product reviews, making it challenging to manually sift through feedback to identify satisfaction levels and areas for improvement. Sentiment analysis offers a powerful solution by automating the classification of customer sentiments, enabling businesses to quickly extract actionable insights from large volumes of reviews. This not only saves time and resources but also provides a deeper understanding of customer satisfaction, helping organizations make data-driven decisions.
By integrating sentiment analysis with business intelligence tools, companies can enhance their reporting capabilities, providing real-time insights into customer sentiment trends.
Moreover, with the ability to detect and address negative sentiments as they emerge, businesses can take proactive steps to improve customer retention and safeguard their brand reputation. In essence, sentiment analysis empowers organizations to stay agile, respond effectively to customer feedback, and continuously optimize their products and services.
Key Steps to Sentiment Analysis Using Microsoft Fabric

1. Data Ingestion and Storage
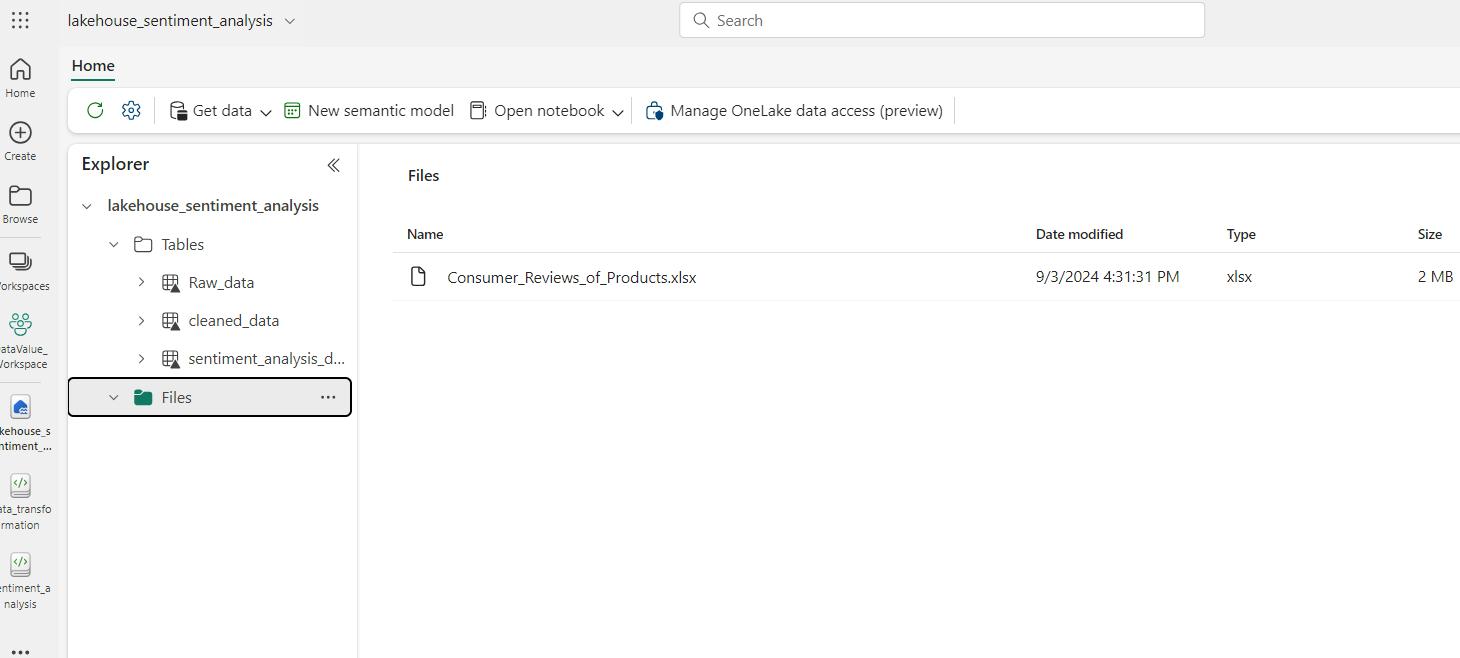
We began by placing the customer review data in an Excel (.xlsx) file, which was uploaded to OneLake File Explorer. This allowed us to keep the data centrally accessible, ensuring flexibility for downstream processes.
Given below is the Lakehouse where we are storing our flat file under Files section:

Note : We have loaded same xlsx file into tables section as a Delta table using Data Factory.
2. Connecting and Preparing Data with Synapse Data Engineering for Sentiment Analysis
The first step was to connect our Excel data from OneLake using Synapse Data Engineering. Synapse helped in cleansing, transforming, and preparing the data for analysis.
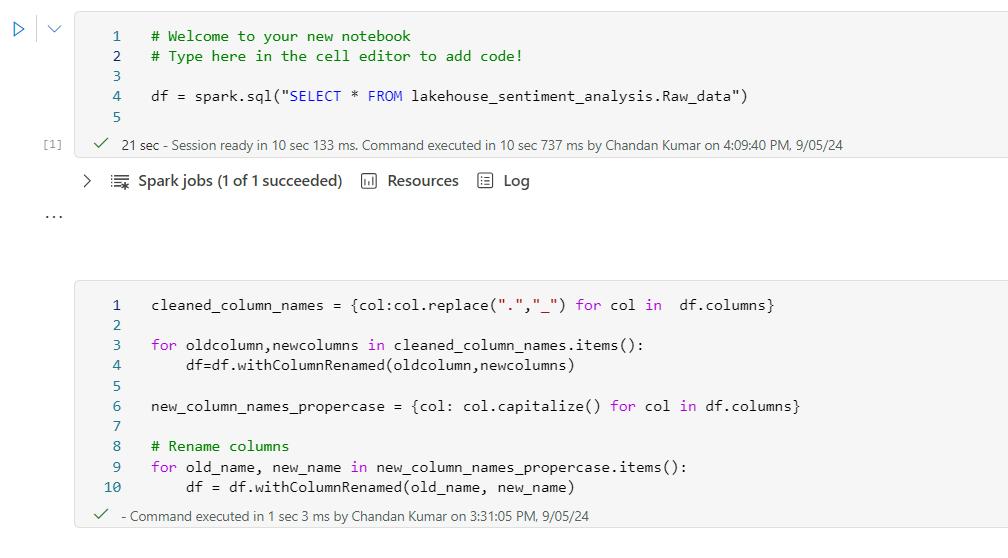
Step 1
These two code cells load and clean a Lakehouse sentiment analysis dataset. The first cell loads the raw data into a Dataframe using Spark SQL. The second cell cleans and renames the column names by replacing hyphens with underscores and capitalizing the first letter of each column, making the data easier to work with.

Step 2
This step removes unnecessary or unwanted columns from the Dataframe to simplify the data and focus on the relevant columns for further analysis.

Step 3
This step defines a function `clean data` that transforms the data types of specific columns in the Dataframe `df_clean`. It converts `Reviews_date` to datetime, then to date, and changes `Id` and `Reviews_rating` to integers (16-bit and 8-bit respectively). The updated Dataframe is then displayed, preparing the data for further analysis or modeling.

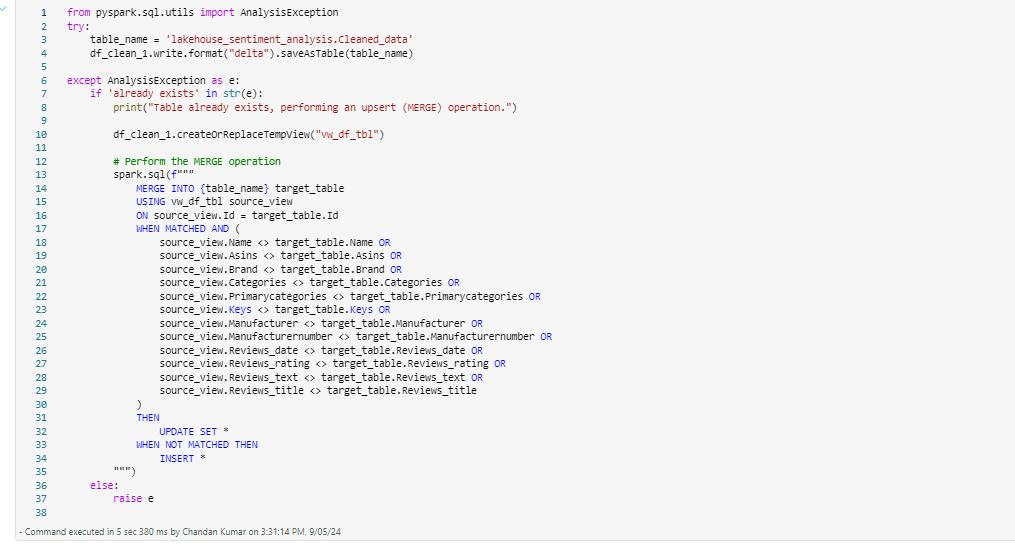
Step 4
This step attempts to write the cleaned Dataframe `df_clean_1` to a Delta table named `lakehouse_sentiment_analysis. Cleaned_data`. If the table already exists, it performs an upsert (MERGE) operation, updating existing rows with new data and inserting new rows. The MERGE operation checks for matching IDs and updates columns if there are changes. If the table doesn’t exist, it raises an exception. This step ensures the Delta table is updated with the latest cleaned data.

(To be continued…)
Click Here for Part Two


 Media Coverage
 Press Release

