Breaking Down the Latest Product Innovations from Tableau Conference 2022
Unveiling the Future: Key Highlights from Tableau Conference 2022
Discover What’s New: Product Innovations Revealed at Tableau Conference 2022
Tableau Conference is the most exciting data event of the year. At the Opening Keynote of TC22, Tableau took it to next level with around 7 Product demos and multiple product innovation announcements.
“83% of CEOs want their Orgs to be more data driven and only 30% believe they are a data-driven organization”, an interesting statistic shared by Mark Nelson, President, and CEO at Tableau Software. This is mainly due to The Data Gap, which constitutes ‘Data Chaos’ of ever-growing data, lack of data skills, inability to build a Data Culture and missing the right data tools to utilize data.
Enhancements in Data Visualization: A Closer Look at Tableau’s Latest Features
Analytics Capabilities Redefined: Exploring the Power of Tableau’s Latest Updates
Empowering Insights: How Tableau’s Product Innovations Drive Data-Driven Decision-Making
Future Trends: Predicting the Impact of Tableau’s Latest Innovations on the Industry
With “Data Everywhere for Everyone” as TC22’s theme, following are the major announcements made by Tableau to empower community in this direction.

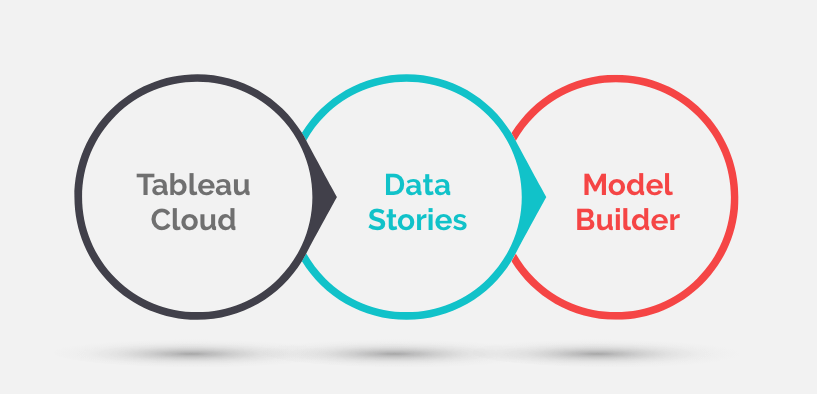
Tableau Online is now “Tableau Cloud”
In the last 3 years, there has been a great shift of enterprise customers toward the Cloud. Data, infrastructure, and analytics are now moving toward Cloud. 70% of new analytics customers start in Cloud for faster data access, faster time to value, and faster innovation.
Introducing Tableau’s Next-Generation Visualization Tools: What You Need to Know
Advanced Analytics Made Easy: New Features That Transform Data Analysis with Tableau
Elevating User Experience: Enhancements in Tableau’s Interface and Interaction Features
Driving Business Value: Case Studies of Organizations Leveraging Tableau’s Latest Innovations
Following are a few major highlights:
- Tableau Accelerators are ready-to-use, fully customizable templates that help organizations get insights and value from their data quickly. More than100 Accelerators are available on Tableau Exchange for use cases spanning a wide variety of industries, departments, and enterprise applications
- Publicly Share Tableau Dashboards, now users can easily embed the code of their tableau dashboard in public web pages and share it with Tableau Non-Licensed users
- Advanced Management Features, to provide better governance, tighter security, and an easier way to share for Tableau Cloud Customers
- Multi-Site Management Tableau Cloud allows Site Administrators to manage Tableau Sites across their Tableau Cloud Environment.
- Extract Encryption provides an extra level of encryption with administrators having full control of managing and rotating encryption keys.
- Admin Insights, with Tableau Cloud, helps admins in better diagnosis, content management, and performance optimization
- Slack Integration for better collaboration
- With the Snowflake Partnership, Tableau offers free credits of Snowflake for Tableau Cloud Customers.
Well, that’s just the beginning of the list! 😊
Francois Ajenstat, Chief Product Officer at Tableau Software, and his team announced many revolutionizing features for Tableau which will increase user adoption and resolve the last mile customer problem.
Introducing “Data Stories” for Tableau
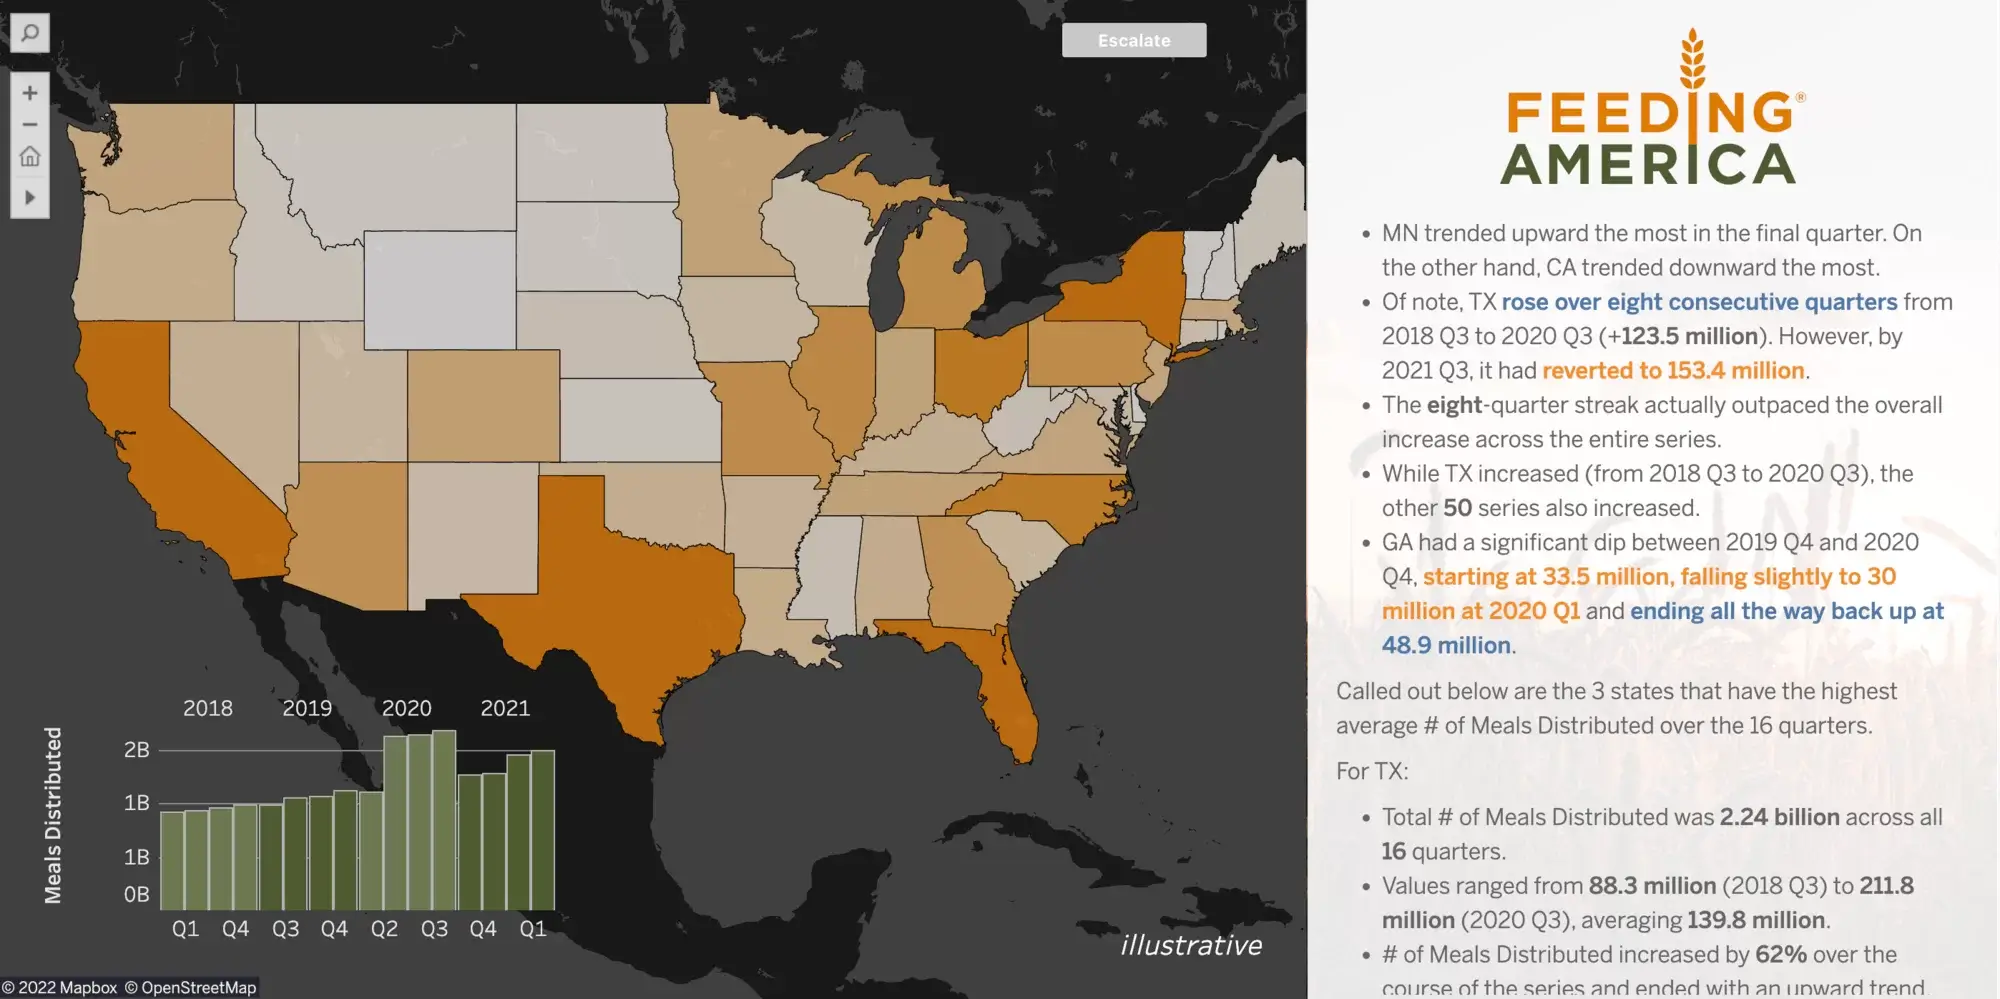
With Data Stories, Tableau has empowered business users to automatically generate meaningful understandable insights and data stories from existing tableau dashboards. It is a powerful storytelling feature powered with NLG (Natural Language Generation) and is now available as a standard feature of Tableau products.
Key highlights which I loved about this feature and make it amazing are.
- Enabling “Data Story” in your dashboards is a straightforward process.
- A user just needs to assign the desired tableau worksheet to the “Data Story” extension > to confirm data sources > its done, meaningful insights are now available in simple English.
- “Data Story” regenerates itself and gives specific insights if users deep-dive or filter for a specific dimension.
- Analysts can also alter the “Data Story” on how it communicates the information like
- Control the Verbosity of the data story as per the audience, limit the level of detail you want to deep dive
- Manage Dimension Characteristics like sorting, number formatting, and data type based on
- Tailor the analysis to be Included & update the confidence interval if required
- Display and Color formatting
- “Data Stories” are Compatible with Mobile layouts

Introducing “Model Builder” for Tableau
Tableau has reimagined the Data Analytics Experience with “Business Science – Data Science for Business Users.”
“Model Builder” is part of a broader portfolio of “Business Science” with “Scenario Planner” & “Einstein Discovery” which enables advanced analytics and predictive analytics for Tableau Analysts.
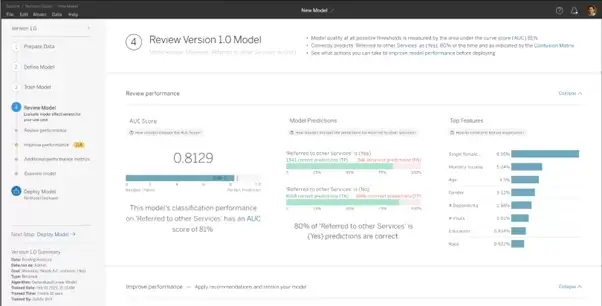
Model Builder empowers users to create predictive models (linear and tree-based) using clicks, not code. Predictive models are now native in Tableau, and they are fully integrated with the entire platform. Analysts can connect to published data sources in tableau and follow simple steps to define, train and deploy the analytic model.
- Prepare Data, connect to the data source, and prepare for model training
- Define Model, Analyst can select a model target, assign a model goal, and modeling algorithms like GLM, GBM, XGBoost
- Train Model and notify recipients when it is done
- Review Model and improve its performance using recommendations generated
- Deploy the Model and Publish it for workbooks that will use these models for predictions. Users can now have the power of Einstein Prediction in their Tableau Dashboards which can be dynamically filtered based on the date selected.
- Integration of pass data from Tableau to Salesforce flows is now possible with a newly added feature.

Tableau introduced “Scenario Planner,” an additional feature that will help analysts build What-if analysis scenarios and provide interactive ways to further analyze them. Data Analysts can create new scenarios wrt baselines, share suggestions and insights on scenarios like why there is a deviation in scenarios.
Additional New Features in Tableau
1. For Building Solid Data Foundation, now we can have Shared Dimensions across multiple fact tables in Tableau Data Source. Allow us to relate multiple fact tables to multiple dimensions together which was not possible earlier.

2. With Web Data Connector 3.0, adding new connectors are now easy as applying on an exchange. Connectors like Twitter connector now run locally instead of APIs, hence providing a better performance experience.
3. “Table Extension” brings the power of R and Python to the core of Tableau Data models.
- An analyst can add Tableau Table Extension in the data source, add desired tables and apply python/R code over the data set to derive desired outputs.

4. New features are introduced in Tableau Prep like adding row numbers, adding new columns based on automatic fill, and multi-row calculation in tableau prep
5. Phares Builder and Phrase recommendation are new features added in Tableau Ask data which offer guided workflow and recommendations to ask the right questions on the dataset.
6. “Data Orientation Pane” will help Tableau users to better view and understanding of the existing dashboards. Everything users need to get familiar with a dashboard like a dashboard description, link to help video, data in viz, applied filters, etc. are in one place through this new feature.
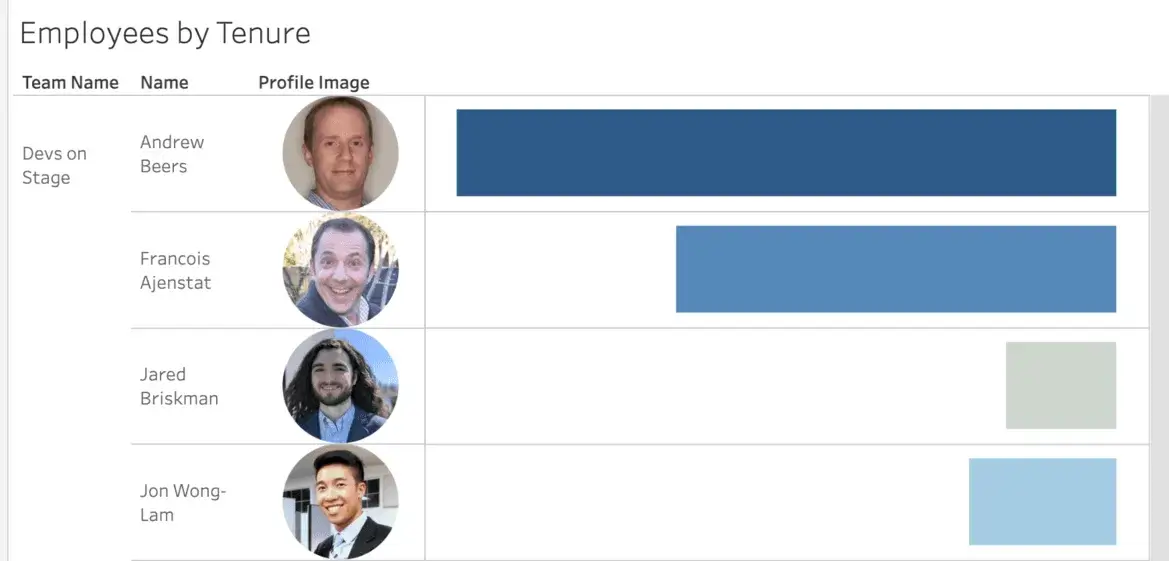
7. “Image Role” feature enables users to link dynamically rendered images through URL in Tableau dashboard.

Wow! It is an exhaustive list of new features and an exciting beginning to TC 22. At USEReady, we are looking forward to these innovative features in upcoming Tableau versions and help customers to succeed with data faster.


 Media Coverage
 Press Release
