 Media Coverage
 Press Release
Amplifying Tableau with Parameters: Dynamic Sorting Explained
Enhancing Data Visualization: Dynamic Sorting Techniques in Tableau
Mastering Parameter Usage: Dynamic Sorting Part 1 in Tableau
As a Tableau developer, I have noticed there are certain features that I use more than others. One that really sticks out is parameters. A Tableau parameter is a workbook variable such as a number, date or calculated field that can replace a constant value in a calculation, filter, or reference line. It enables users to take their analysis to next level by giving an input control over the visualization with combination of calculation and parameter controls, users can add a variety of interactivity in their Tableau dashboards.
“In this first blog of my “Parameter Amplified” series”, I would like to introduce how to add a dynamic, interactive sorting feature to your Tableau dashboard by leveraging a parameter.
Let’s start with a simple table show below built using the Superstore sample data set. Tableau provides multiple built-in methods to sort a view: single click options from an axis, header, or toolbar etc., or choose any embedded method from the “sort” menu for specific field.
Understanding Dynamic Sorting in Tableau
Implementing Dynamic Sorting with Parameters in Tableau
Exploring Advanced Sorting Techniques in Tableau
Leveraging Parameter Amplification: Dynamic Sorting Part 1
Introduction to Dynamic Sorting: A Tableau Tutorial
Step-by-Step Guide to Implementing Dynamic Sorting in Tableau
Advanced Tips and Tricks for Dynamic Sorting in Tableau
Practical Applications of Dynamic Sorting: Real-world Examples and Case Studies
Selecting any field (e.g., sort “State” by data source order descending) by clicking on the axis and use the “sort” button.
However, build-in functions only allow user to sort the table by the fields on Rows shelf or Column shelf. Any possibility to sort the table by any field not used in this sheet? Parameters here come for helping. I would like to introduce two approaches step by step below.
1). Dynamic sorting with parameter control at row level.
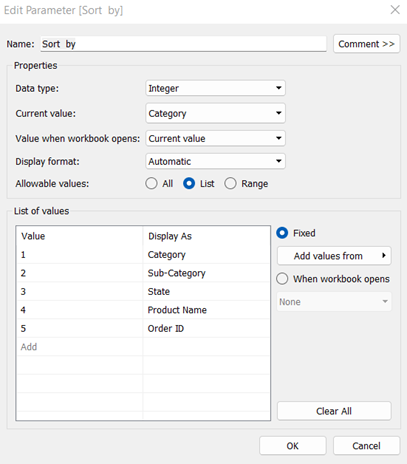
Step 1: Create a Parameter
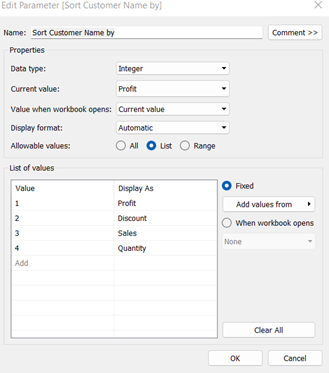
First, we need to create a parameter. Give it a name as “Sort by” and set each property as it shows in below screenshot. Select “Integer” as “Data Type”, and “List” as “Allowable values”. Enter names for all variables would use for sorting in the “List of values”.
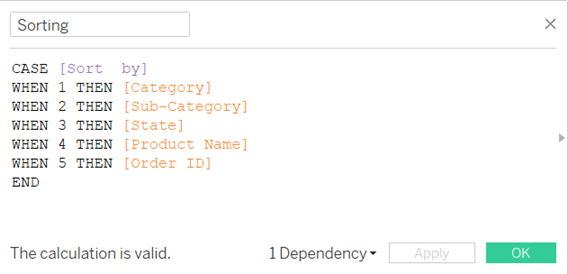
Step 2: Create a calculated field
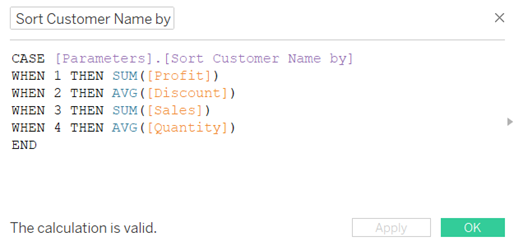
Next, create a calculated field with simple “CASE” statement. This step is needed to link the parameter to actual values from your data. Please note that, the text after “When” clause has to be the same as what be put in “List of values” in step 1.
Step 3: Sort the table by field “Sorting”.
First, drag the field “Sorting” to the Row shelf and make sure put it in the first row. This step is the key to sort the entire table at row level! Then right click on “Sorting” and select “Sort”, set up the sorting as requires. Here, we use a simple sorting with data source order – descending as an example.
Step 4: Show Parameter control
Right click on parameter “Sort by” and select “Show parameter control”.
Step 5: Hide “Sorting” from the text table by unselecting “Show Header”
Finally, right click “Sorting” on the Row shelf, in the drop-down menu, unselect “Show Header”. That’s it!
2). Sort a specific field on shelf by any measure in your data set. E.g., Sort “Customer Name” by any measures.
Step 1: Same as the first approach, you will need to create a Parameter “Sort Customer Name by” and Calculated field “Sort Customer Name by”.
Step 2: Use build-in function to sort “Customer Name” by calculated field “Sort Customer Name by”
Step 3: Show Parameter control, then all set!
With just a few simple steps, you have now given the end user flexibility over how they want to sort their data. The dropdown menu is easy to understand and will encourage users to play around with the visualization and hopefully ask more questions of their data. Parameters are dynamic and powerful. In this blog series, I will introduce more techniques to expand our reach in Tableau with Parameters.