Mastering Tableau: A Guide to Modifying Totals for Enhanced Data Analysis
Enhancing Visualizations: Techniques for Modifying Totals in Tableau
Total Control: Customizing Totals in Tableau for Better Insights
Tableau provides us the ability to have totals/grand totals for a measure. But do you know that you can override the default aggregations provided and display a completely different value?
Let’s look at this data where we have the total quantity by year and month.

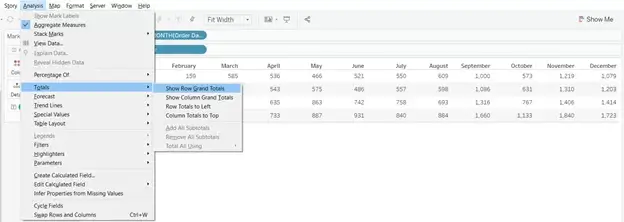
To view the year totals across all months and/or month totals across all years, we would enable the totals as needed.
Understanding Totals in Tableau: An Overview of Grand Totals, Subtotals, and Custom Totals
Step-by-Step Guide: How to Modify Totals in Tableau Dashboards and Reports
Advanced Techniques: Customizing Total Calculations for Specific Analytical Needs
Tips and Tricks: Best Practices for Modifying Totals in Tableau Visualizations

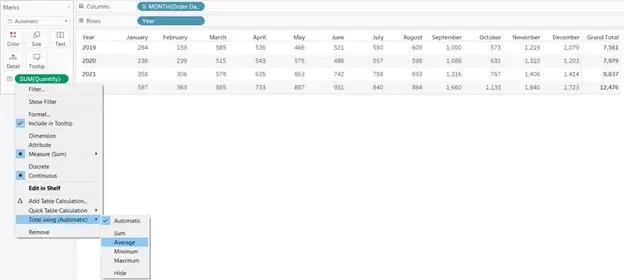
We now have the totals of the quantity for each year.

If we want to view the average quantity for each year rather than the sum, we can change how the totals are computed and get the desired output.

We now have the average of the quantity across all months for each year in the grand totals.

But what if we want to view a total value which is not among the options (Sum, Average, Minimum, and Maximum) provided? This can be achieved using calculated fields.
For example, let us see how we can view the total change between the first and last months for each year in the totals.
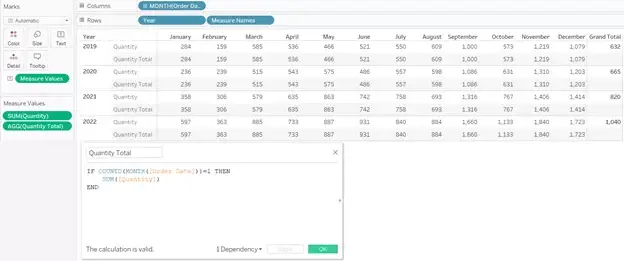
We can start with a calculated field that gets us the total quantity for each year and month and view it on the data pane along with the quantity measure.

We see that we have the same values for each year and month except for the totals. The values show up only when the distinct count of a month in a column is one, and do not show up in the total column since there is more than one month of data.
Customizing Grand Totals: Strategies for Tailoring Total Calculations in Tableau
Optimizing Subtotals: Techniques for Adjusting Subtotal Calculations in Tableau
Creating Custom Totals: How to Define and Apply Custom Total Calculations in Tableau
Improving Data Insights: Using Modified Totals to Enhance Tableau Dashboards and Reports
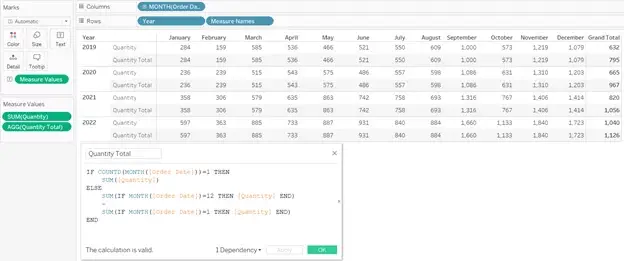
We can now modify the calculation to compute the total change and display.

We can now remove the original quantity measure to get the final output as desired. We can also change the “Grand Total” header to something more meaningful as “Total Change.”

We now have the total quantity by year and month, and the total change in quantity from the first and last months of each year.


