Essential Techniques for Debugging SQL Queries
Troubleshooting SQL Errors in SSMS
Optimizing Query Performance in SQL Server
Common SQL Errors and How to Resolve Them
Debugging Tools in Microsoft SSMS
Best Practices for Query Troubleshooting
Enhancing SQL Performance Through Debugging
Using Execution Plans for Query Analysis
Identifying Bottlenecks in SQL Queries
Debugging with SQL Server Profiler
Handling Complex Joins and Subqueries
SQL queries are essential for performing database operations in Microsoft SQL Server. While executing SQL queries, we frequently encounter errors that can be difficult to resolve. These can sometimes take hours. Similarly, when writing queries, you may face issues like performance bottlenecks, errors, and unexpected results. To address this, it is essential to develop effective strategies for quickly debugging and troubleshooting SQL queries. By mastering these techniques, we can significantly reduce the time and effort spent on resolving issues.
In this blog, we will explore some practical ways to efficiently diagnose and fix problems with SQL queries in order to help you streamline your workflow and enhance your productivity.
Tools for Debugging SQL Queries
SQL Server offers several tools that aid in debugging and troubleshooting queries:
- SQL Server Management Studio (SSMS): An interactive environment that allows you to write, execute, and debug queries. SSMS includes features like query execution plans and performance analysis tools and various commands which can fetch information about queries.
- SQL Profiler: A tracing tool to monitor SQL Server activity, useful for identifying long-running queries and performance bottlenecks.
- Extended Events: A lightweight performance monitoring system that helps track performance issues and capture query execution events.
- Dynamic Management Views (DMVs): System views that provide information about server health, query performance, and database activity.
Tips for Debugging and Troubleshooting Queries
1. Check SQL Syntax:
Generally, we tend to overlook minor details when writing queries. Therefore, it is important to first verify the query you’ve written to ensure it is correctly formatted. Small mistakes such as missing parentheses, misspelled functions, missing commas, or incorrect keywords can cause issues, so make sure to check it carefully.
Example:
SELECT first_name, last_name, email FROM customers
WHERE join_date >= '2023-01-01 AND status = 'active'
Mistakes in the Query:
- Missing Quotation Mark: The date string is missing an ending quotation mark.
- Incorrect Use of Logical Operator: The AND condition is not correctly separated from the date string.
- Missing Semicolon: The query is missing a semicolon at the end.
2. Simplify the Query:
When you’re working with SQL queries that are 100 lines or longer, it can be hard to find mistakes. If you encounter an error, try running each section of the query individually. This approach makes it easier to locate and fix the problem quickly.
Complex Query example:
Suppose you have the following complex query that is not working as expected.
Here’s what you can do:
SELECT
  e.EmployeelD,
  e.Name,
  d. DepartmentName,
  (e.Salary + b.Bonus) AS TotalCompensation
FROM
  Employees e
JOIN
  Departments d ON e.DepartmentID = d.DepartmentID
LEFT JOIN
  Bonuses b ON e. EmployeeID = b.EmployeelD
WHERE
  e.Hire Date >= '2023-01-01'
Step 1: Simplifying the Query:
- Test Join with Departments
- Test Join with Bonuses
Step 2: Verify Calculations and Conditions
- Test Basic Calculation
- Check Date Filtering
Step 3: Combine and Test
3. Minimize Locking:
Use the NOLOCK hint for read-only queries to avoid locking other transactions:
SELECT * FROM Orders WITH (NOLOCK)Example:

In the command column, the second query is shown as waiting for the first query to complete. This can be resolved with the help of NOLOCK hint.
Note: Be cautious, as this can lead to dirty reads if used inappropriately.
4. Identify Blocking Queries:
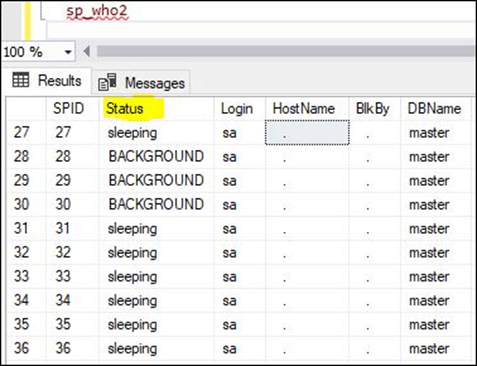
Use sp_who2 or Activity Monitor in SSMS to identify blocking sessions.
Example:
EXEC sp_who2
The Status column indicates the current query process.
STATUS Info:
Background: The process is for a background task i.e. LOCK MONITOR.
Sleeping: The process is waiting for a command.
Pending: This means no thread has been assigned to the session.
Running: This status refers to running of batches and consumption of CPU cycles.
Runnable: It has been assigned a thread, but the CPU cycle is not available.
Suspended: The process is waiting for the resources.
You can also identify blocking queries by checking the BlkBy column, which indicates whether a query is being blocked by another session.
5. Analyse Execution Plans:
Use the Execution Plan feature in SSMS (right-click and select “Include Actual Execution Plan”). Execution plans visually represent how SQL Server executes a query, highlighting inefficiencies such as:
- Table Scans: Occur when SQL Server reads all rows in a table. Replace with indexes to speed up query execution.
- Nested Loops: In some cases, inefficient joins can lead to nested loop operations that degrade performance.
- Indexing: Ensure your tables are properly indexed. Missing or use of incorrect column or outdated indexes often cause performance bottlenecks.
Example: Run the following query to identify missing indexes:
SELECT * FROM
sym.dm db missing index details
6. Use Proper Filtering:
Utilize WHERE clauses to limit the amount of data being processed. This is particularly helpful for large datasets.
For example:
SELECT * FROM cars WHERE
sellingDate >= '2024-01-01'
This helps SQL Server limit the dataset, improving performance.
Debugging and troubleshooting SQL queries in Microsoft SQL Server is a multi-faceted process that involves analysing syntax, logic, performance, and concurrency issues. By making use of the built-in tools like SQL Server Management Studio, SQL Profiler, execution plans, and DMVs, you can efficiently resolve issues, optimize query performance, and ensure smooth database operations. With these techniques, you’ll be well-equipped to handle any query-related challenge in SQL Server.


 Media Coverage
 Press Release

