 Media Coverage
 Press Release
Mastering Localization in Dashboards: A Comprehensive Guide
Creating Multilingual Data Visualizations: Best Practices for Dashboards
Harnessing the Power of Localization in Dashboards for Global Audiences
What is Localization
Localization is the comprehensive process of adapting insights to the culture and language of users. With the internet blurring geographical boundaries, access to products, information, and services has become universal. This globalization of markets, from a business perspective, has created both opportunities and challenges.
There’s never been a better time to enter foreign markets with your product or service. On the other hand, the task of making your offering relevant, unique, and tailored to local markets has become more complex than ever. Customers’ expectations are higher than ever, and they demand a seamless and personalized experience throughout the customer journey – no matter where they are in the world.
Why We Need Localization in Dashboard
Localization will increase customer satisfaction
Customers will only pay attention to the information, if you’re addressing their needs in a way, they feel comfortable and understand well. Localizing the content in adaptive user regional language creates different impacts in terms of adoption.
Understanding the Importance of Localization in Data Visualization
Best Practices for Implementing Multilingual Dashboards in Tableau and Beyond
Tools and Techniques for Effective Dashboard Localization
Case Studies: Successful Examples of Multilingual Dashboard Design
Introduction to Localization in Dashboards: Why It Matters
Step-by-Step Guide to Localizing Dashboards for Global Audiences
Leveraging Tableau Features for Seamless Dashboard Localization
Tips for Designing User-Friendly Multilingual Dashboards
Your customer could be from any region and the best you can provide them is a localized dashboard that they can easily understand in their own language. Suppose your customer is from China and has been viewing dashboard in the English.
He understands his regional language better than English, what if he gets the dashboard in his regional language like Mandarin, he will be more comfortable and understand the dashboard more effectively.
Localization will increase brand loyalty
If you provide your users with a satisfying user experience you will start to gain their trust, which is essential for brand loyalty. Communicating with your users in their native language and tailoring your dashboards will help you gain their trust. Satisfied customers will be loyal to you and are likely to stick around to become true advocates of your products.
Dashboard Will Be More Functional
Suppose the Salesforce Org that you are working on is used across various geographical locations. A dashboard would be best accessed if the text labels within it display the language most used in each region.
Your dashboard will be more functional with the existing features and localization. With this you can show all the charts title and labels in other languages too.
Managing Your Languages
From the Multilingual dashboard, you can manage all your languages. Easily add, hide, and remove languages from your dashboard and site. This means that you can add the languages you need and hide them until you are ready to display that language version of your dashboard.
Customize the regional settings of your language. When choosing a language locale, the formatting of dates, numbers and other metrics are automatically localized to that specific locale.
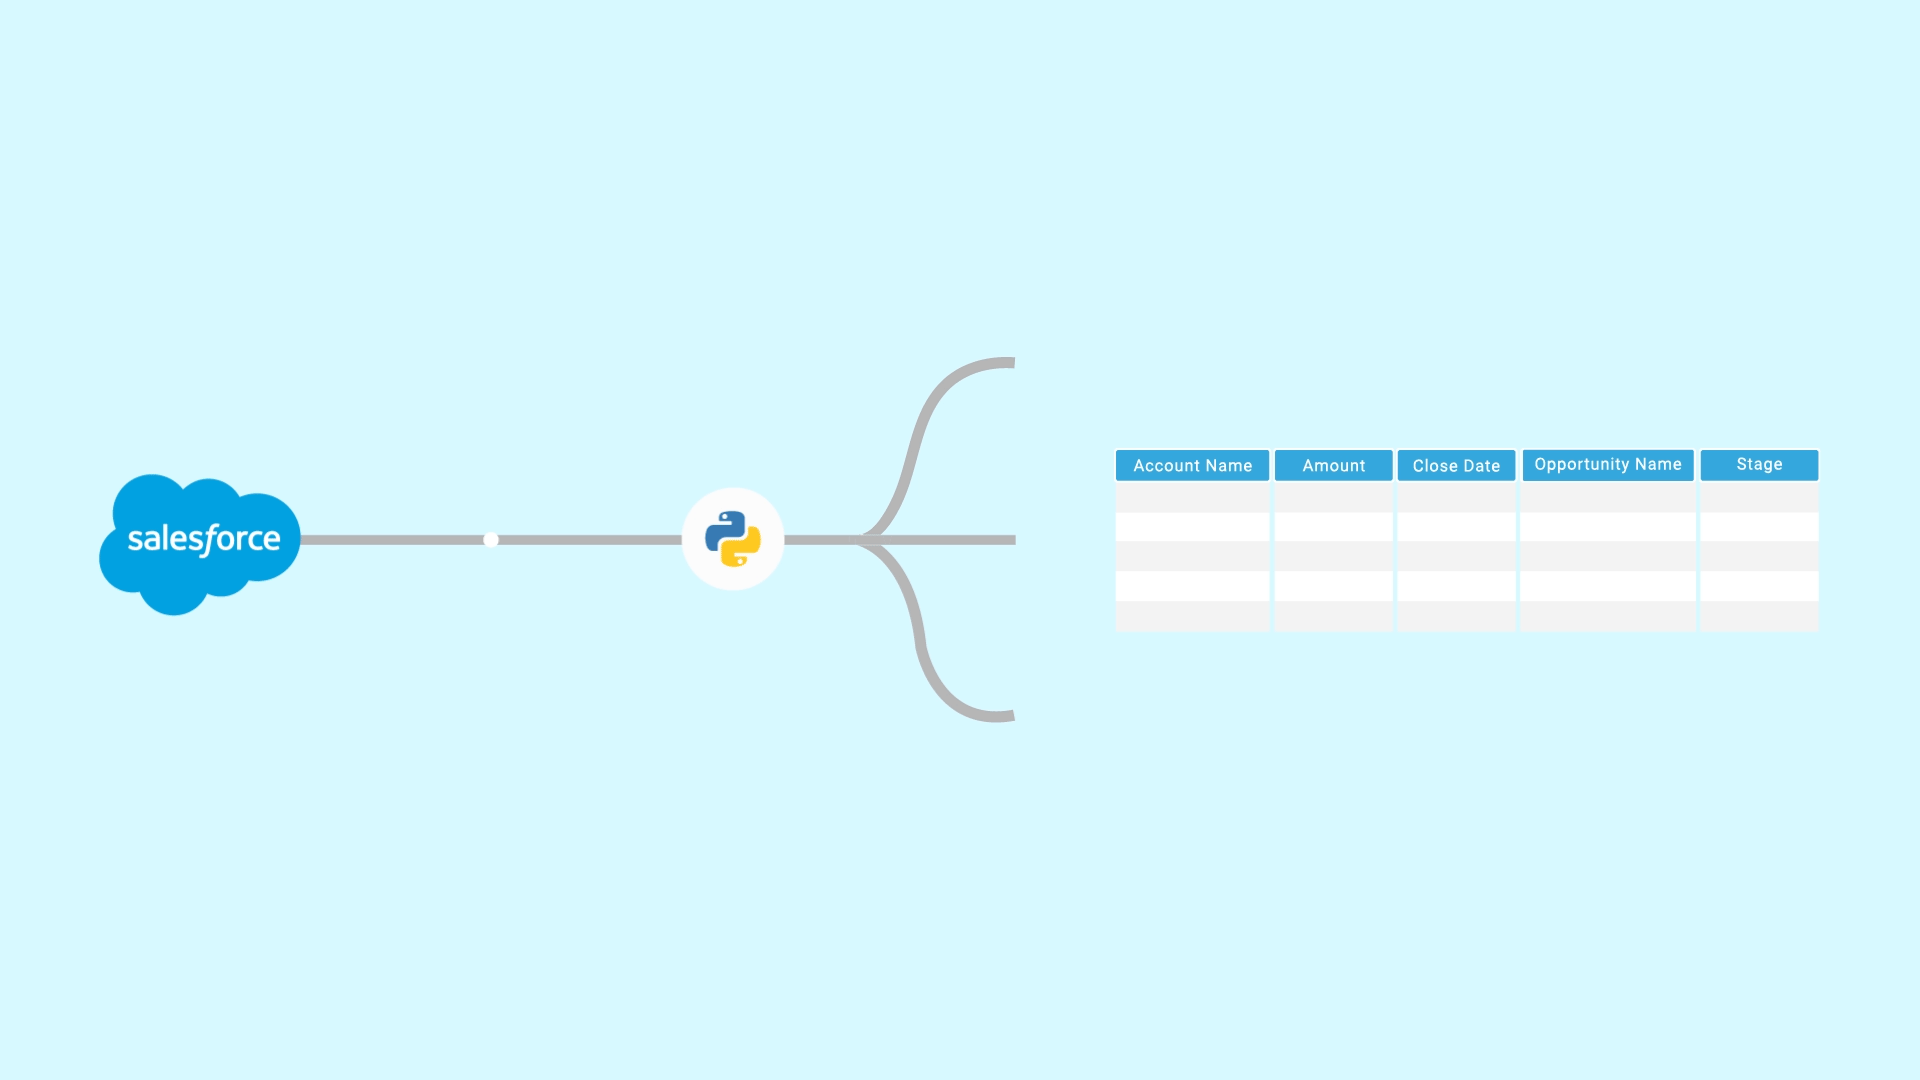
Steps To Achieve Localization in CRM Analytics
A multilingual dashboard can be achieved in a series of steps.
Step 1: Create a Custom Metadata Type in Salesforce for Each Dashboard
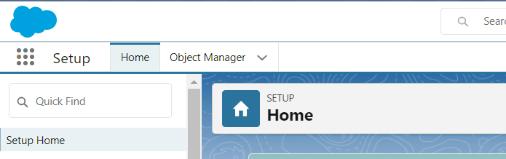
I. Simply go to Setup→
II. Type Custom in Quick Find Box→
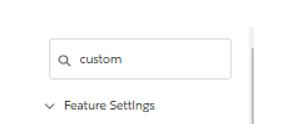
III. Select Custom Metadata type.
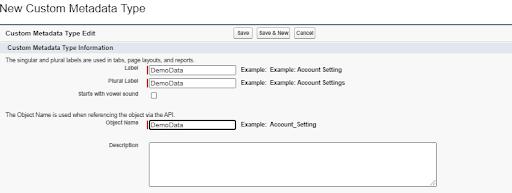
IV: Then create new a Custom Metadata type with the following label and API name as given:
V. For each label in a dashboard, create a custom picklist field in the Custom Metadata type. For instance, let’s say the demo dashboard looks like this:
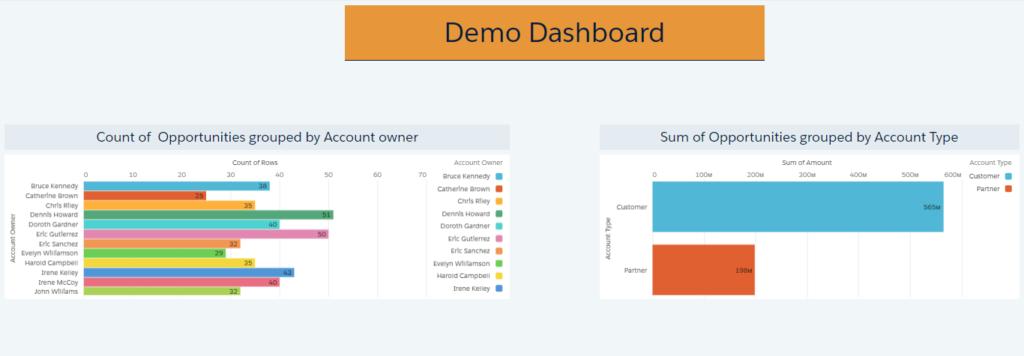
VI. We can clearly see that there are three labels in the dashboard, so the in the next step, we will create three picklist fields in the DemoData Custom Metadata type as follows:

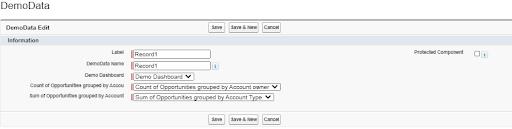
VII. Then, create a single record for DemoData by selecting values for custom field as given below:
Step 2: Adding Translation Using Translation Workbench
For each language that the dashboard should support, a translation would be added. This is when the translation workbench is used. Remember, the translation workbench does not translate the labels — it only stores the translation for labels that we add into it.
I. To do so, go to setup → translation workbench → translate.
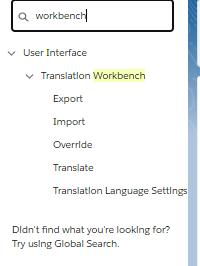
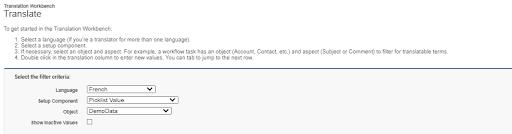
II. Select the language for which the translations will be added, then the object (Custom Metadata) that was created. In the setup component, opt for Picklist Value.
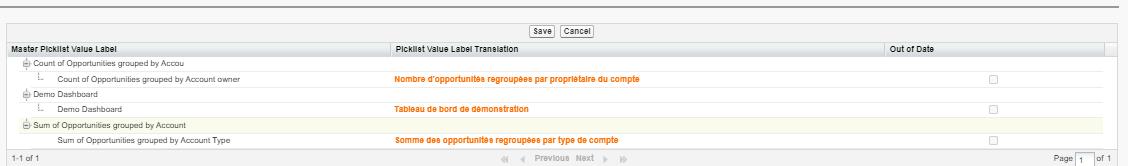
III. In the lower panel, add translation for all the picklist fields, and click save.
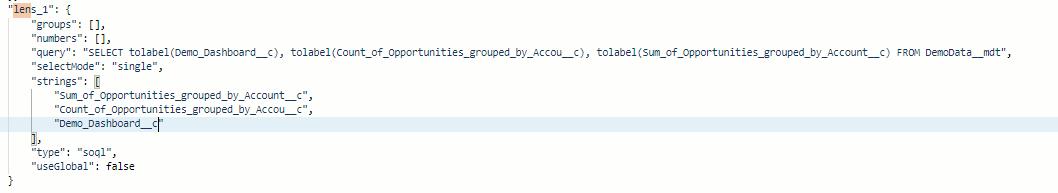
*Note: In this way, we have created a separate translation list for a particular language. This will be used in the dashboard using the tolabel() function in SOQL query.tolabel() to convert the fields into the user’s language if the translation workbench is enabled. The SOQL, along with tolabel(), displays the labels in a language based on the currently selected user locale field.
Step 3: Adding SOQL Query for DemoData to the Dashboard
The SOQL query to fetch the field from DemoData would appear as shown below:
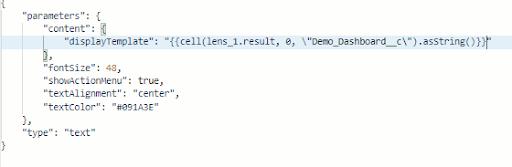
Step 4: Adding Result Binding to the Text Labels in the Dashboard
Finally, our last step would be to bind the fields to the labels in the dashboard. Pass the SOQL field result to the text label using result binding as follows:
Conclusion
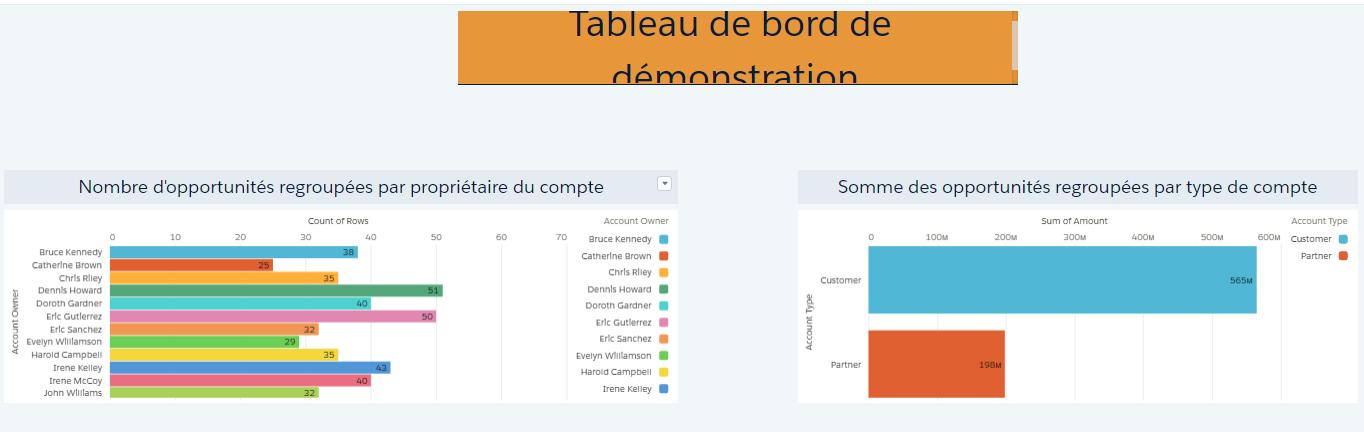
With the simple change in user’s locale, the language of dashboard labels would be updated as shown in the diagrams below.
To test this, change the default locale of the user to French, and see the magic for yourself!
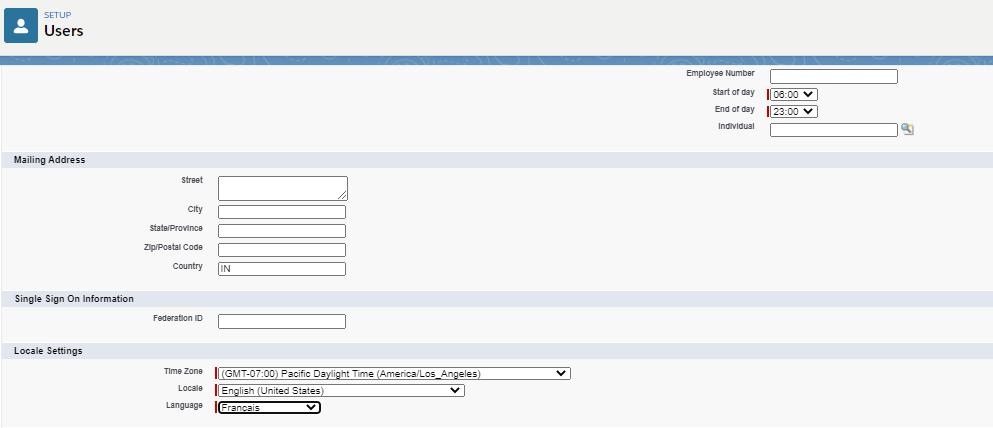
After updating the user language to French, the language of dashboard labels has automatically changed to French.