Keeping Your Data Fresh: Guide to the Latest Data Refresh in Tableau Prep Builder
Ensuring Accuracy: Performing the Latest Data Refresh in Tableau Prep Builder
Mastering Data Preparation: Latest Refresh Techniques in Tableau Prep Builder
Tableau Prep Builder (Maestro → Prep → Prep Builder) was created as a very simple data preparation/transformation tool to cater the daily data needs of Tableau developers. Prep Builder has slowly evolved into a better ETL tool since the last 2 years. The TC 2019 showed improvements and new features in the tool. It is also very satisfying to see many customers using Prep for their data repair needs instead of going for expensive ETL tools.
This will be one of the first Prep Builder blogs on our website after our ‘A Practitioner’s Guide to Prep Builder’ book release. Here, will be tackling a very simple problem through a use case. In one of the other blogs, we had seen the latest file refresh using Tableau Desktop. The same requirement is needed in Tableau Prep Builder. The general assumption for Prep users is that if Tableau Desktop can do, Tableau Prep will be able to do the same things because it is an ETL tool with much better data cleaning and data filtering operations. Most of that is true, but all the Tableau Desktop functions cannot be exactly replicated in Prep. So, we will discuss the alternate solution for Prep users.
Understanding Data Refresh in Tableau Prep Builder
Step-by-Step Guide to Performing the Latest Data Refresh
Best Practices for Ensuring Data Accuracy in Tableau Prep Builder
Troubleshooting Common Issues with Data Refresh in Tableau Prep Builder
Requirements:
a) The Marketing team gets a monthly data feed with all the events in a database. Based on those events, the Sales and IT resources are assigned.
b) A Prep Builder flow needs to be created to only generate the latest month’s data which will be used in the Marketing Dashboard.
The solution would be to generate a Date Placeholder for the latest month available and filter only to extract that month’s data.
** The data might not get populated every month. It could also skip a couple of months where no events are planned.
For the purpose of this blog, as mentioned before, we will use local files to demonstrate the concept which can applied elsewhere. We are using some of the files that we used in the other blog to demonstrate the features here.
** One very important requirement to provide a solution is the requirement of a timestamp that can provide the month and year information. If data is stored in the database, there must be a date field that can specify what month and year the data is for. If the data is being fed every month from a local file (in a shared folder), the file must have a month and year identification.
The reason we need this is to create a date field which will be seen in the steps.
We will start with 3 files. Feb 2019, April 2019 and May 2019. For these files, we will create a workflow for the latest month. Then add a couple of more files and rerun the workflow to get the latest values.
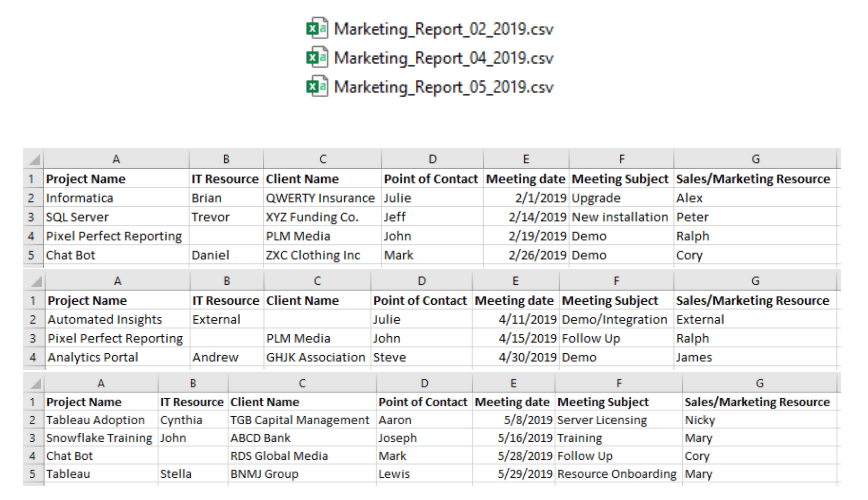
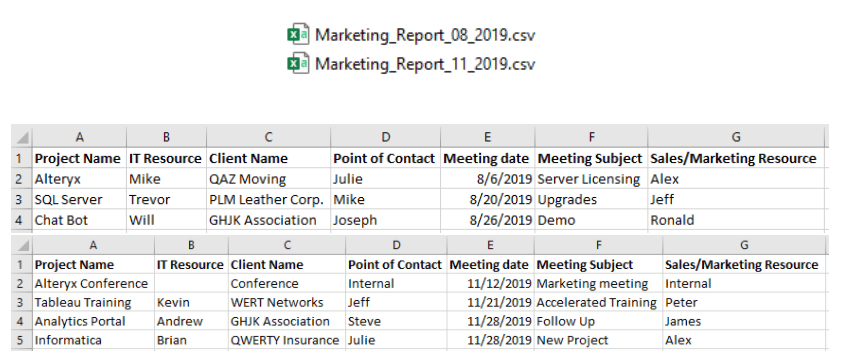
From all these files, we can notice the Meeting Date field and the File name. Both have information with respect to a particular month.
For this example, we will use the File name to create our Date field.

1) We will start by connecting to one of the text files.
2) Similar to Tableau Desktop, we can navigate to the folder and it displays all the files of the same format in that folder. Once connected, we shall go for all data (in case of the database) or Wildcard Union in our case because of multiple files that have the same structure.
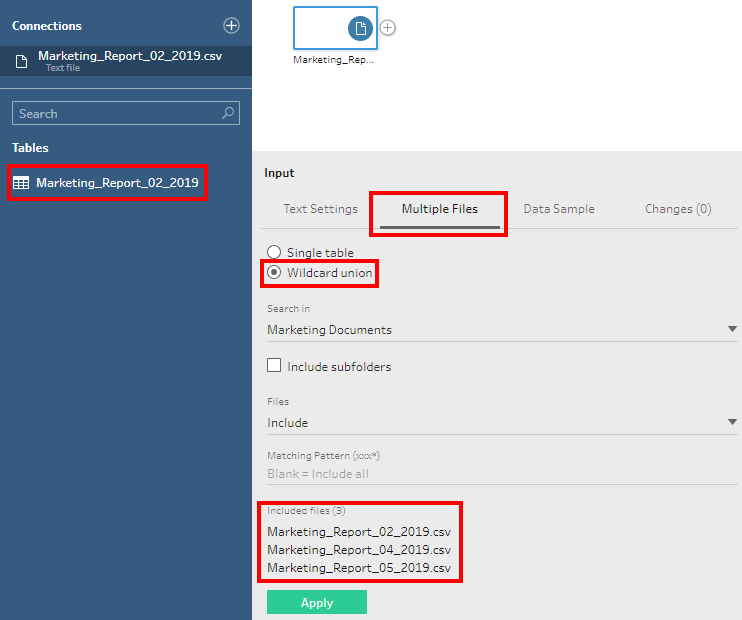
We will provide the Marketing* as the search pattern. The folder might have different files. So we need to narrow down our search for the required text files.
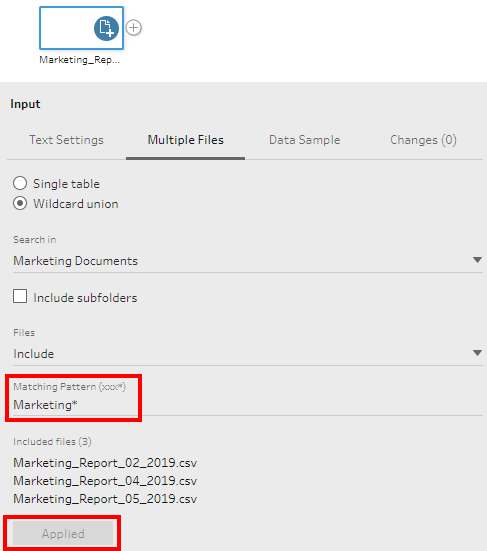
We can see that there is a small ‘+’ symbol within the Input Data step which is a visual cue for multiple files.

At this time, we shall save the flow as .tfl. It is better not to use .tflx extension as it will package the entire workflow with the data. This will affect our refresh.
3) Next, we will add a Cleaning step to have a look at the underlying data.
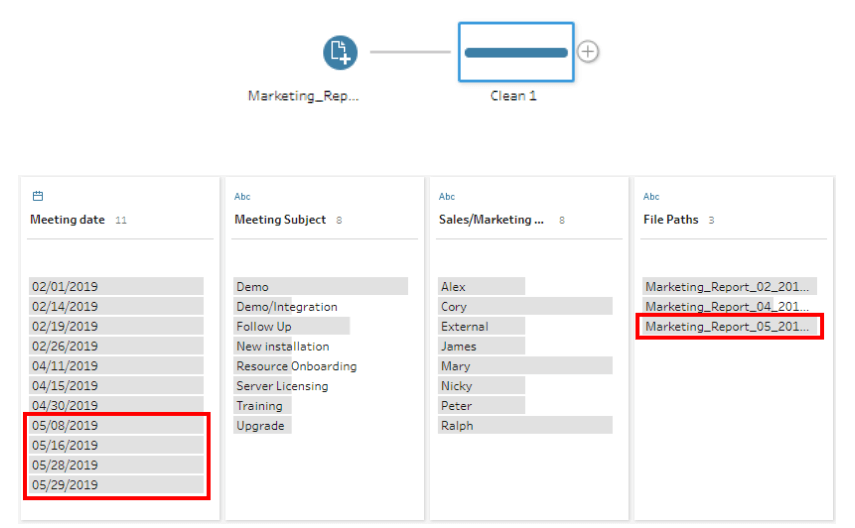
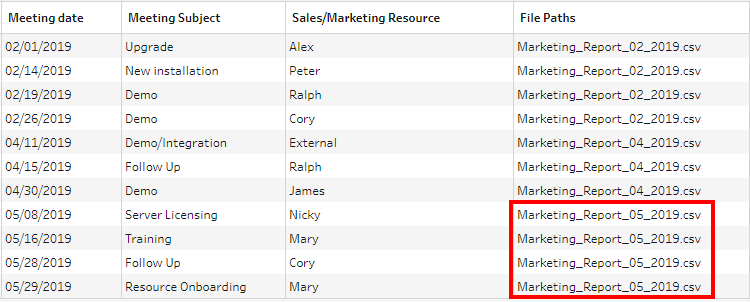
From the Profile pane and the Preview pane (Data Grid), we can see the File Paths. We need to isolate only the latest data.
We can directly use the Meeting date field for our future steps. But we are keeping the situation open in case there are dates from other months. So, we will use the File Paths field. The reason to use File Paths is that it will give us a chance to look at some Calculations.
4) We need to isolate the Month and Year from the File Paths field. So, we will use the Split function. The Split function works exactly as Tableau Desktop.
It has Automatic Split and Custom Split. The Automatic Split will split a String field into two pieces based on the most common delimiter (Special character) at the first instance (occurrence in the field). The Custom split is more flexible where we can specify the delimiter and number of split columns.
We can either use the Split function or the ready Split option in the Profile card. To make it easy, we shall use the latter approach.
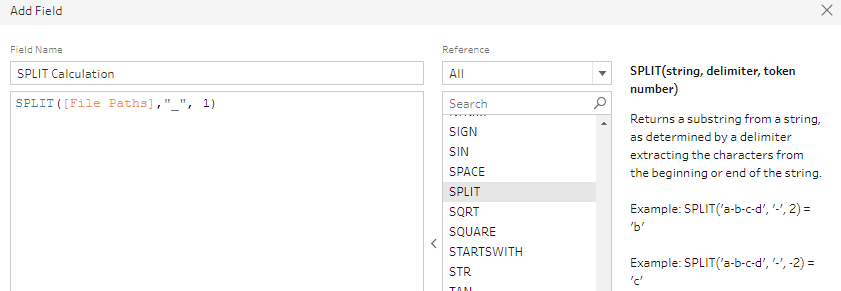
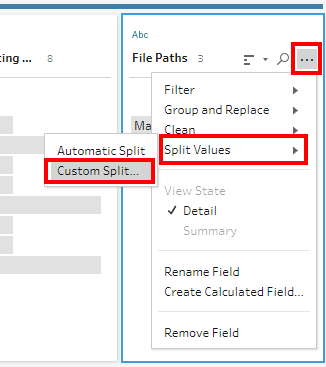
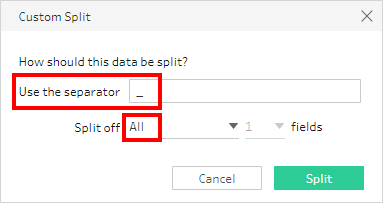

5) We have the Month field ready. We need one more Split to isolate the year (removing the .csv)
This time, we can use Automatic split.
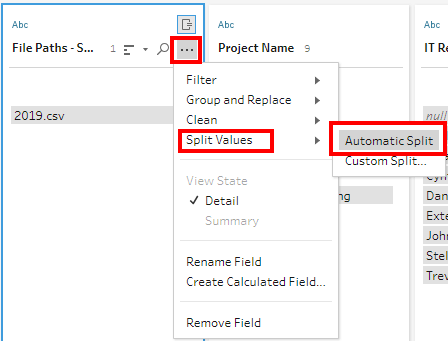
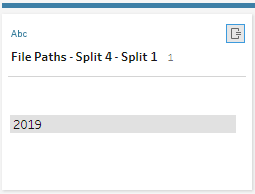
If there were other years in our dataset, we would see more listings.
We can rename the fields accordingly. Here the fields that we need will be named Month and Year.
6) In this step we will create a new Date field using the newly created fields. For the Day, we will use a constant 01 to denote the first day of the month.
The MakeDate field similar to Tableau Desktop, needs a Day, Month and Year field. All these fields need to be of integer Data type. So, the field data type can be converted using the Profile card features. Some databases that we connect might not provide the MakeDate function. In such cases, we can create a Key field using YYYYMMDD format.

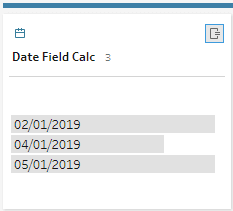
7) This step is an important one. Now, we need to isolate the Maximum Date.
At this juncture, we might go wrong at two places.
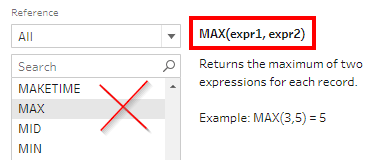
The first intuition would be to use Max() function. This will not work. We need to remember, unlike Tableau (which works on Aggregations), Prep Builder works on Row level data.
The MAX() function is designed to find the greater value between two numbers.
The second intuition would be to use a Relative Date filter for last month. As we had mentioned in the beginning, the data might not be continuous. We are building this solution assuming there will be breaks/gaps in the data feed.
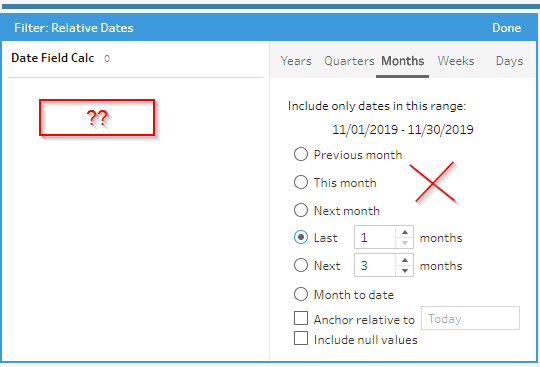
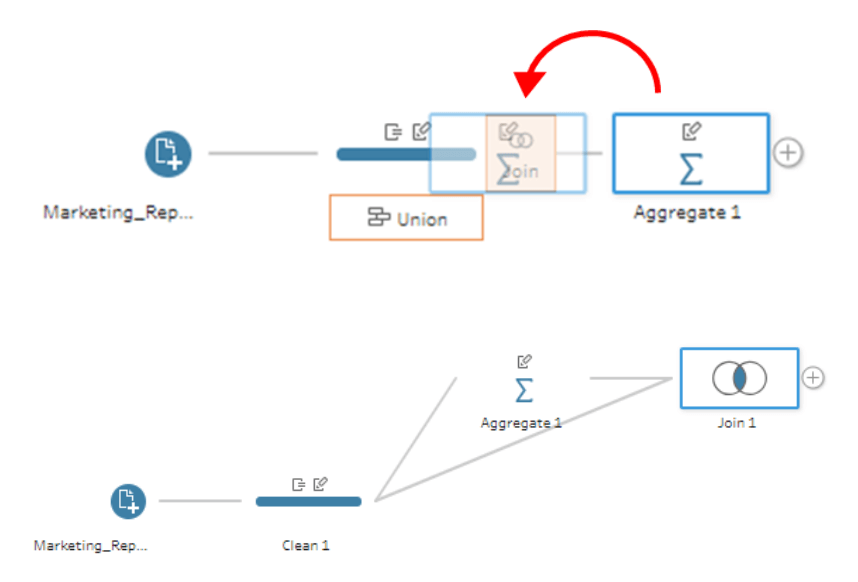
Both these options will not work in our case. So we need to introduce the Aggregate Step. The advantage with the Aggregate step is that we don’t need to specify the Group By feature.

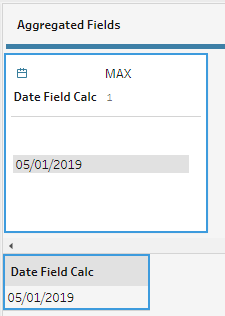
We can rename the field to anything convenient for identification
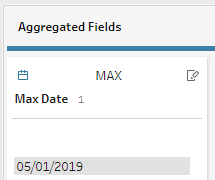
8) This step is also an important one. Now that we have the latest Date from our data, we need to join this result back to the previous step and use an inner join on the Date Calculation to isolate only the required Dates.
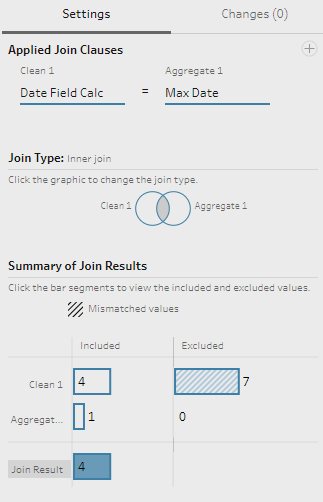
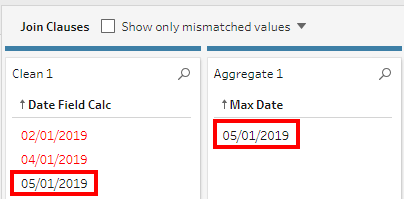
We can see from the Preview that the required values are ready.
We can add a Clean step if needed, remove some fields, rename some steps.
9) The last step would be writing the data into a file or Hyper or publish directly to the Server.

To test with some other files.
Adding the August data to the folder and running the workflow (or refreshing the flow) again.

Adding the November data.

Exploring the Importance of Regular Data Refreshes
Leveraging Automation for Seamless Data Updates
Strategies for Optimizing Data Refresh Performance
Enhancing Data Quality through Refresh Processes
The final flow looks like this.


