Leveraging Portal Pages: A Guide to Metric Insights Implementation
Organizing Business Intelligence Content: Portal Pages in Metric Insights
Maximizing Effectiveness: Implementing Portal Pages for Better BI Management
What is Metric Insights?
Metric Insights is an operator of a Business Intelligence Platform used to empower businesses to effectively cut through data clutter. It helps to track metrics from business intelligence tools, big data, and SaaS applications, and uncovers anomalies and notifies users of significant changes in data that requires their attention that enable clients.
Why Metric Insights?
Organizations that are struggling with a lack of usage and ROI for their BI practices and the users are overwhelmed with too much information, and they do not know what they can trust. Metric Insights’ Enterprise BI Portal works by integrating all BI tools, reporting, and metrics into a single, consolidated catalogue of governed BI assets that users can access knowing it contains content they can trust.
What are Portal Pages?
Portal Pages uses to enables the development of single webpages and multi-page websites hosted on Metric Insights.
They are incredibly flexible allowing to utilize the basic toolset for building websites that are: -
- HTML
- CSS
- JavaScript
The tools allows & permit a User to create highly curated experiences around content from any source supported in Metric Insights.
Understanding Portal Pages in Metric Insights
Step-by-Step Tutorial: Implementing Portal Pages for Your BI Platform
Best Practices for Organizing Content with Portal Pages
Enhancing BI Management: Leveraging Portal Pages in Metric Insights
Introduction to Portal Pages and Their Role in BI Management
Implementation Steps: How to Set Up Portal Pages in Metric Insights
Tips for Effective Content Organization on Portal Pages
Leveraging Portal Pages for Seamless Business Intelligence Integration
Portal Pages can be embedded directly into existing Metric Insights Portal, or we can use the Layout function to create our own branded portal or website in which to embed these Pages, with no visible Metric Insights UI.
Steps to Create Portal Pages
Set the system variables for portal pages
Go to: ADMIN > SYSTEM > SYSTEM VARIABLES
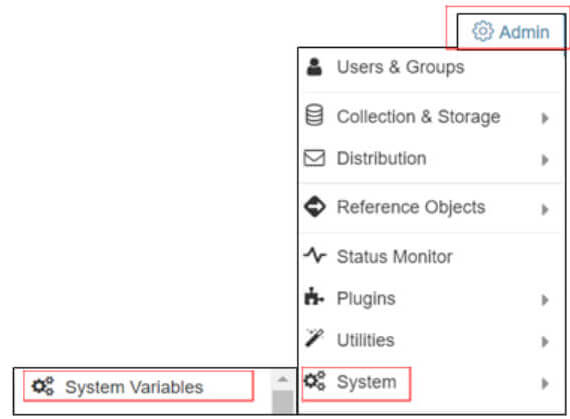
The system variables page will be loaded as shown in below: –
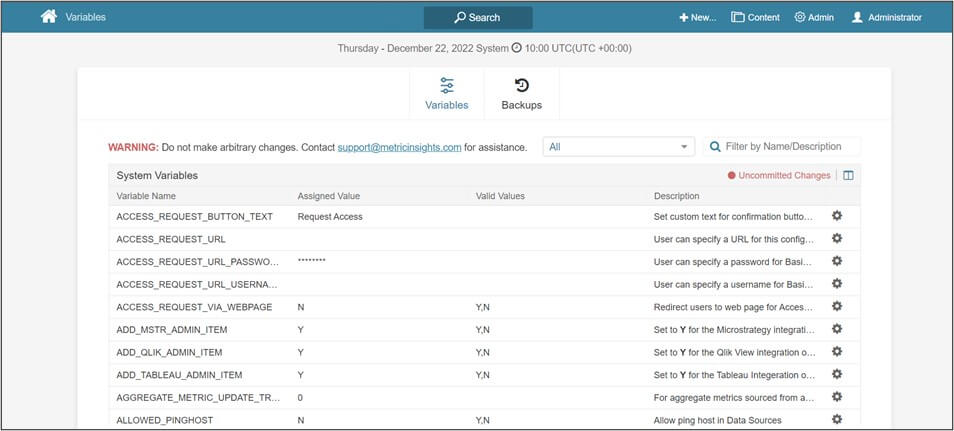
To filter out system variables for portal pages use filter box and type ‘portal’, it will display all the variables for portal pages (as shown below).
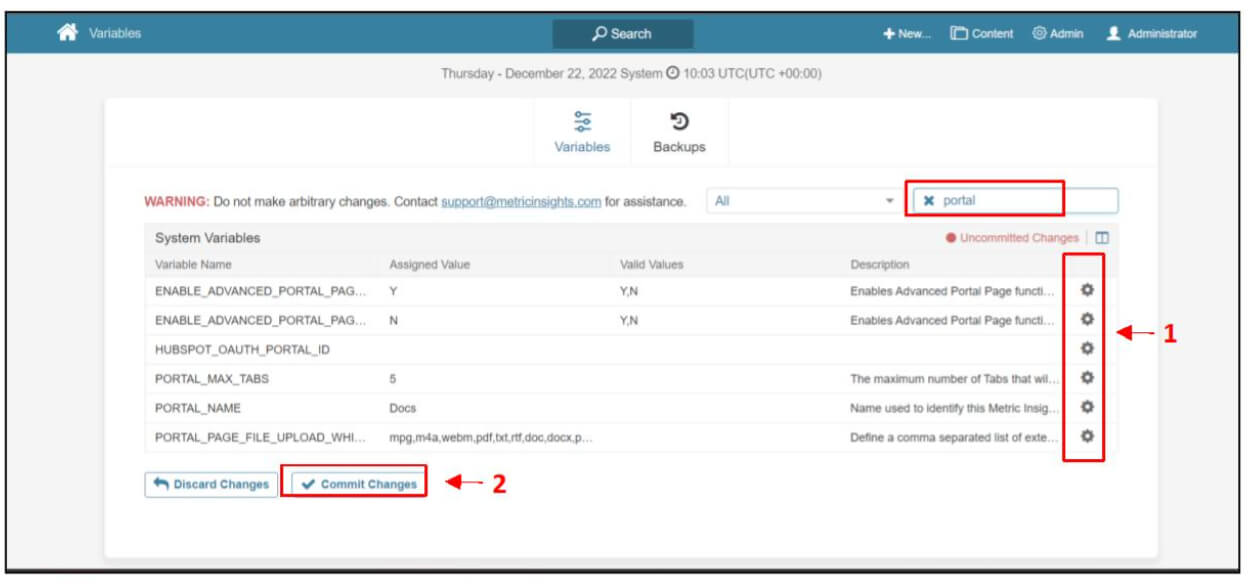
- Click on the gear symbol to assign new values and save it.
- Click on ‘Commit Changes.’
Example of Portal page
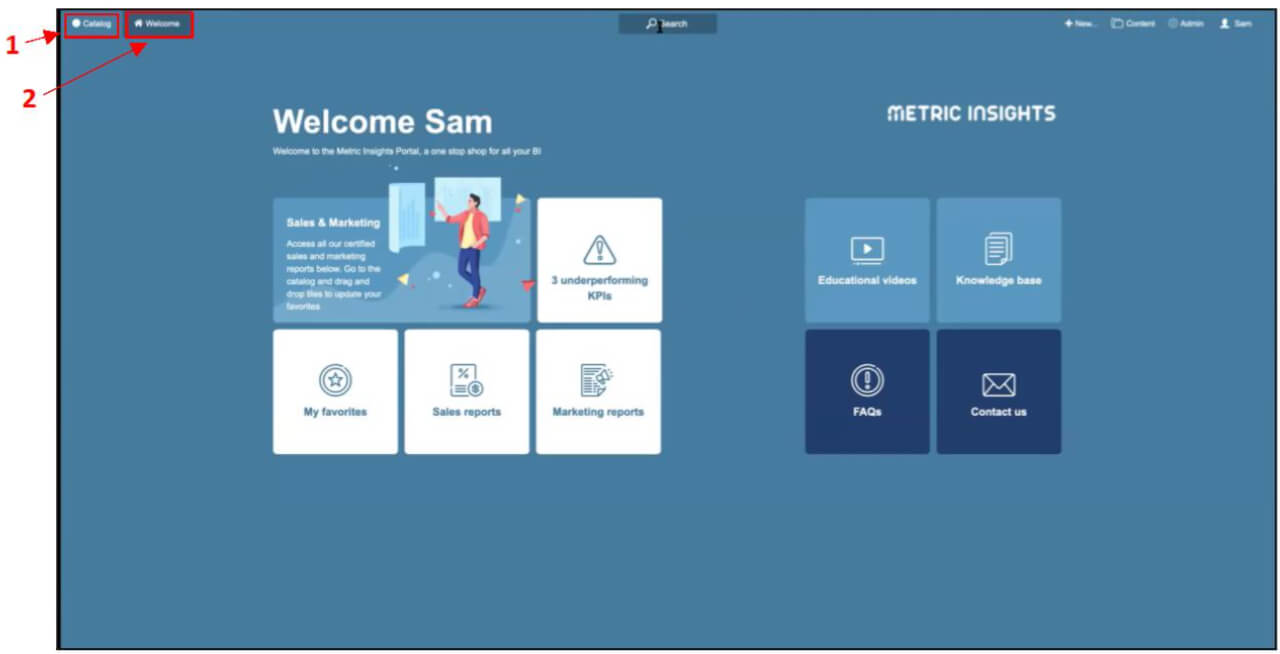
- The traditional Homepage appears as Catalog in Metric Insights.
- Portal Pages appears as tabs
To create a portal page with a welcome message.
I. CREATE A TEMPLATE– Template pages are used to write the code for our webpage, upload images that we need to add in our page.
Go to: CONTENT > PORTAL PAGES
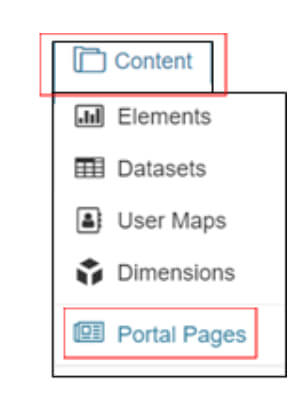
It will load the page as shown below
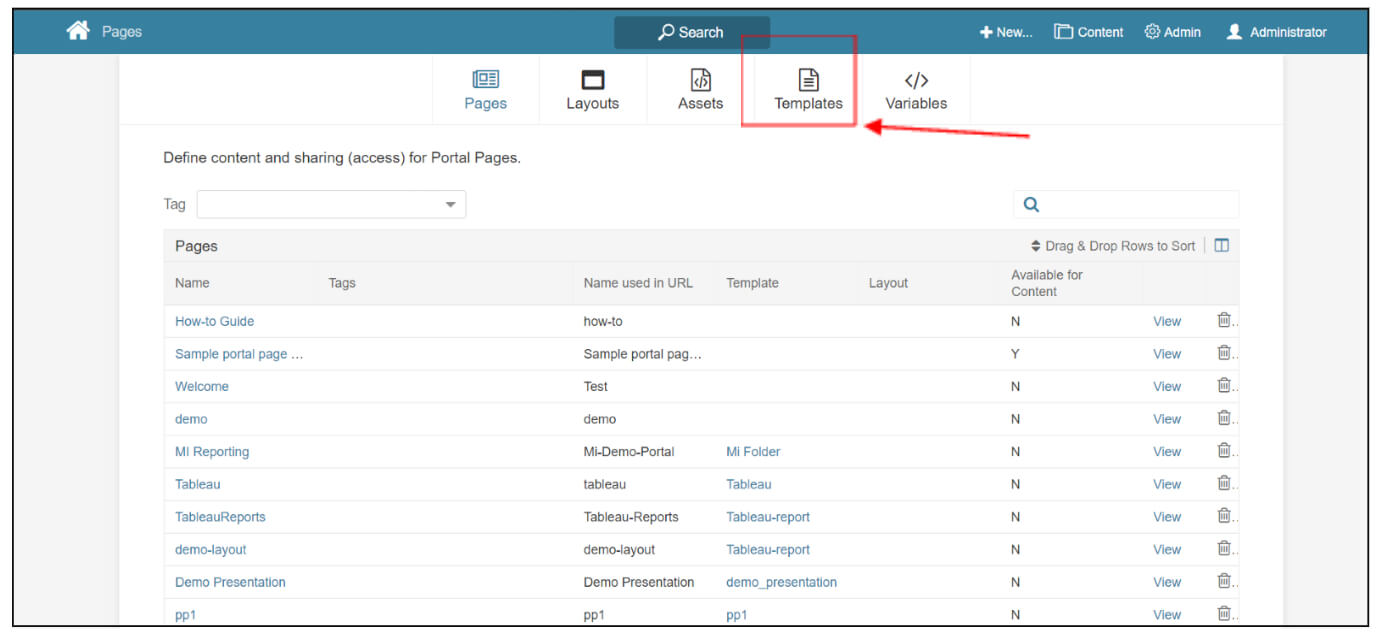
Click on the Templates section as shown above.
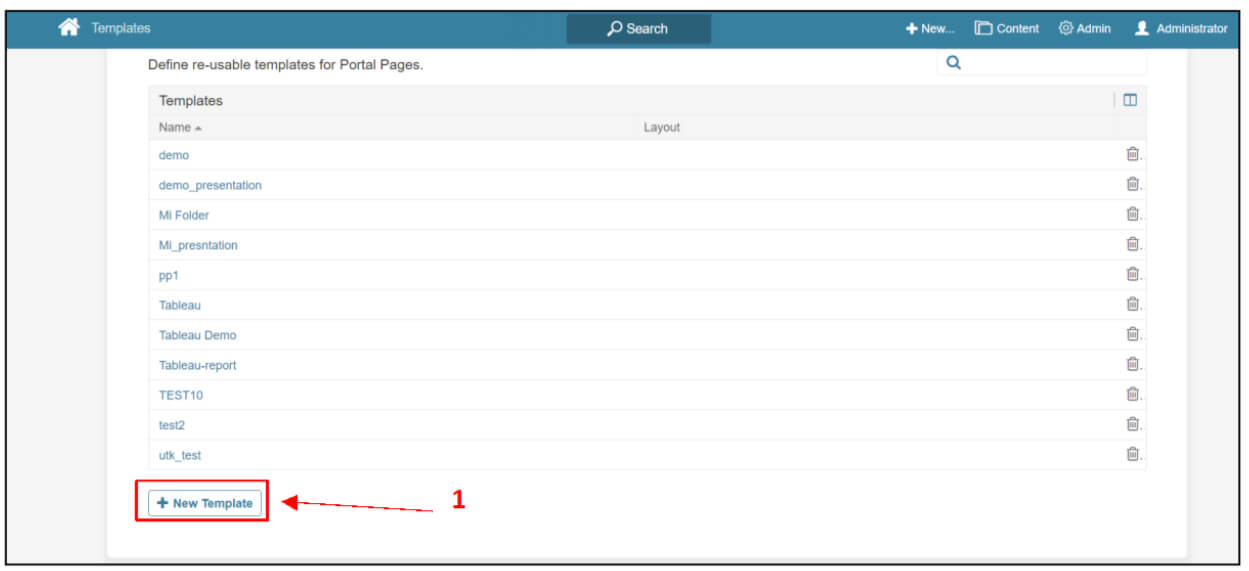
1. Click on +New Template

2. Give a name for the template page
3. Give an Internal name which will be used to build a page URL (avoid spaces)
4. Click on Save
After you click on save it will open configure page for template as shown below: –
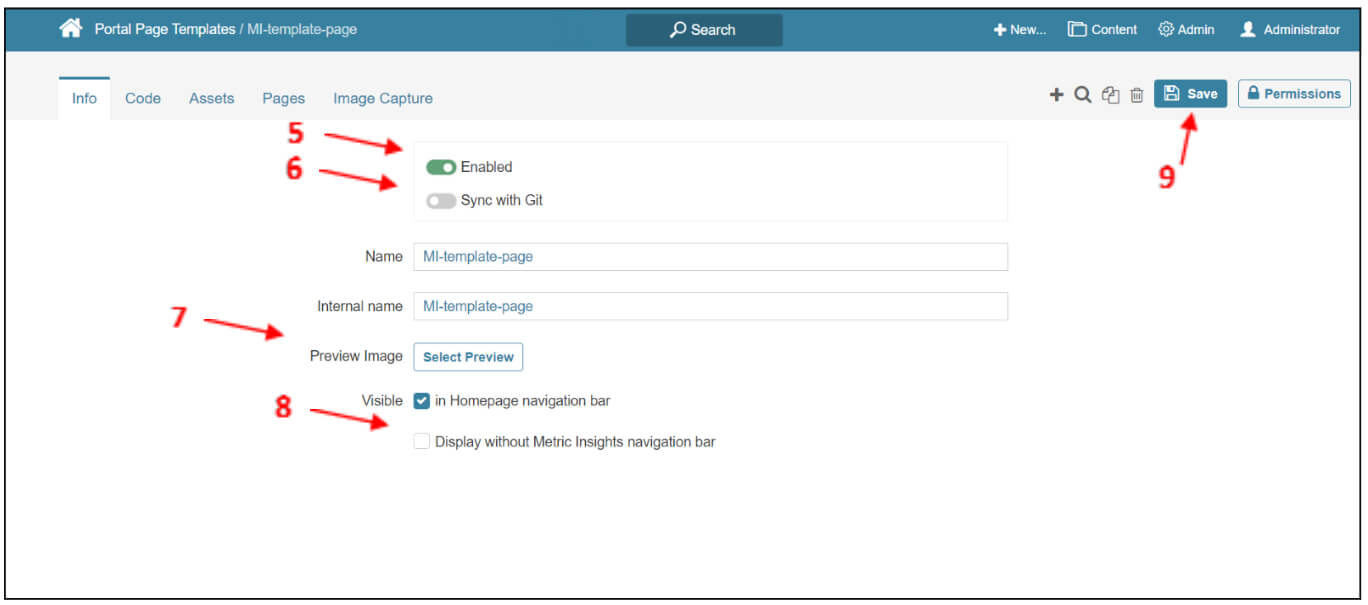
5. Enable it to use it as a template
6. Enable ‘Sync with Git’ to upload assets from a repository located in:
- GitHub
- GitLab
- BitBucket
7. You can select a Preview Image (Optional)
8. If you enable this then you can choose a personalized layout from the Layout drop-down else you will get the default Portal Page Layout.
9. Click on Save
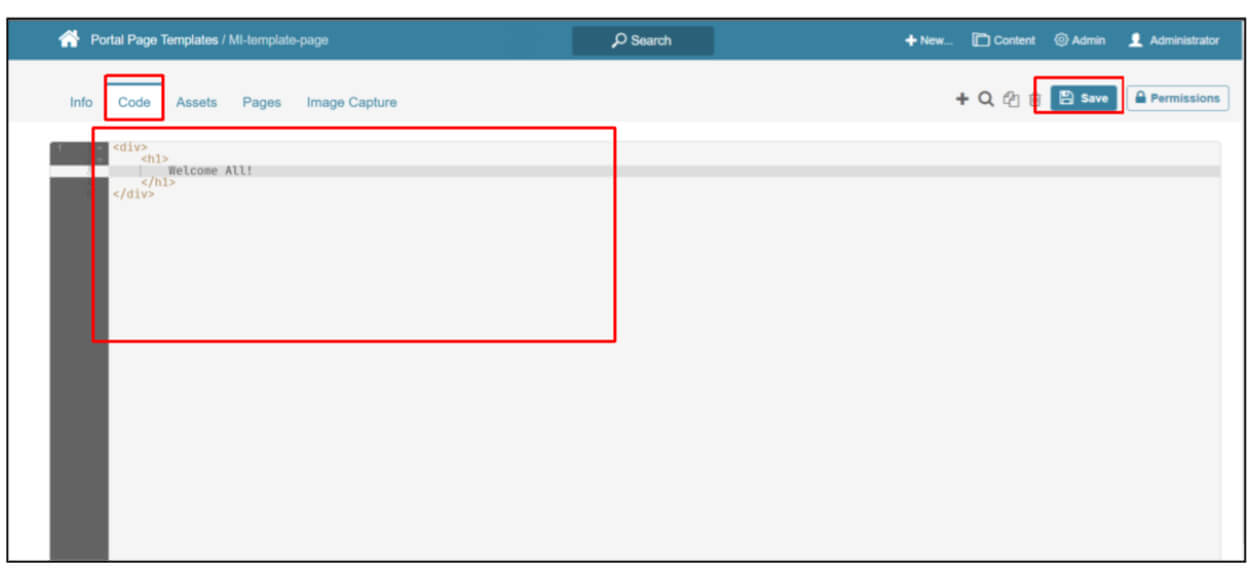
After you click on Save, go the code tab and write a simple Welcome message. As per the portal pages requirement we need to write javascript.
Click on Save.
Go to Image Capture tab to customize the condition to take a Portal Page screenshot for an External Report.

10. Timeout: specify a time interval after which a screenshot is taken once the Portal Page is opened
11. Screenshot on: select a condition of taking a screenshot. Note that a screenshot will be taken when the selected condition is met or after the time interval specified in the Timeout field has elapsed
- Only on Timeout: a screenshot is taken after time interval specified in the Timeout field.
- Element Removed from Page: this condition is appropriate if you want a screenshot to be taken after some element disappears from a Portal Page. The element can be set in the CSS Selector field; e.g., if you want a screenshot not to be taken until the Portal Page is fully loaded, enter .loading to the CSS Selector field.
- Element Added to Page: select this condition if you want a screenshot to be taken when some element appears on a Portal Page. The element can be set in the CSS Selector field.
12. Save it.
II. CREATE A PAGE- Pages are used to host your template pages on metric insights server.
Go to Pages tab
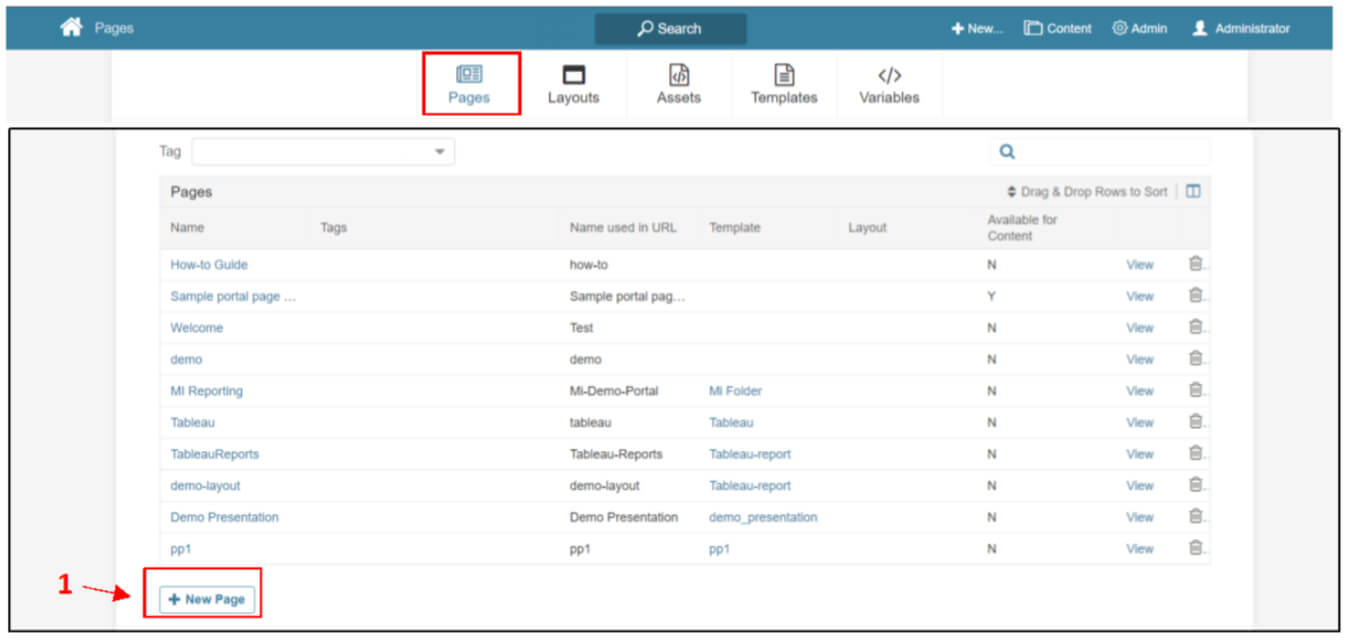
1. Click on ‘+New Page’

2. Give a name for the page.
3. Provide a name to be used in page URL.
4. Choose the template that you created.
5. Click on Save.
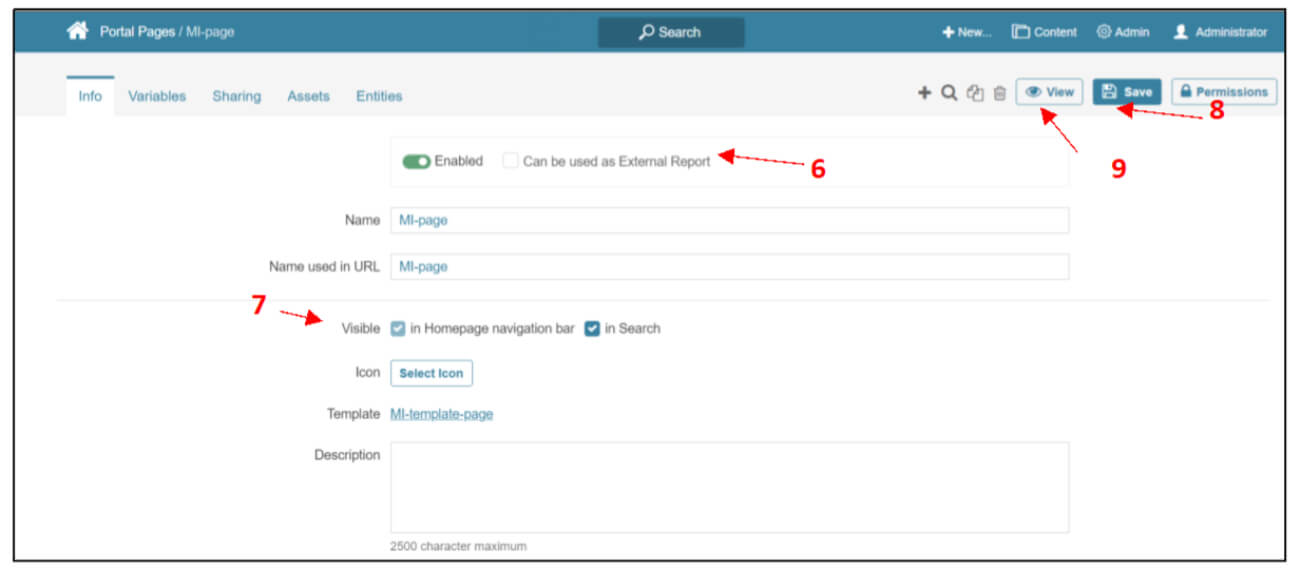
6. Check to use the Portal Page as an Object for External Report creation
7. Optionally, exclude the page from Homepage navigation bar and search
8. Click on Save
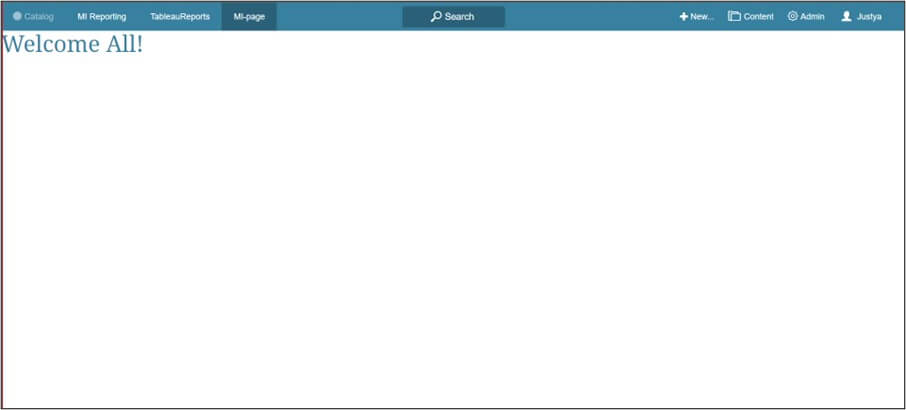
9. Click on View
Once you click on View it will show your newly created webpage as shown below:-
Sharing Portal Pages
Click on SHARING tab.

1. When the access restriction toggle is enabled, User who:
- is not in share Access list (specified below) AND
- does not have edit access to the Portal Page AND
- is not Admin
2. Will see the Access Denied message that can be customized.
I. Add Groups and Users Manually (via Portal Pages)
Scroll down and go to ‘Groups with Access Page’ and click on Add Group


3. Select Group
4. If start page is set to ‘yes’ then they will start on this Portal Page rather than Category page
5. Save it


 Media Coverage
 Press Release

