


 Media Coverage
 Press Release
Why Managing Stale Content Matters
Step-by-Step Guide to Detecting Stale Dashboards
Best Practices for Keeping Tableau Server Clean
Understanding Stale Content in Tableau
How to Identify and Flag Unused Reports
Automating Content Audits with Tableau Tools
Enhancing Performance by Removing Stale Dashboards
The Impact of Stale Content on Tableau Performance
Key Metrics to Monitor for Content Relevance
Leveraging Tableau Metadata API for Content Auditing
Implementing Governance Strategies to Maintain Clean Reports
As a Tableau Server administrator, one of your critical tasks is managing server content efficiently to ensure optimal performance, storage management, and data relevance. Over time, Tableau Server accumulates a significant amount of content, including workbooks, dashboards, and data sources. Some of this content may become stale—unused or irrelevant over a long period—and identifying it is essential for maintaining a clean and efficient Tableau environment.
In this blog, we will explore how to identify stale content on Tableau Server by creating an intuitive dashboard that provides insights into workbooks, views, and data sources that haven’t been accessed or modified in a long time.
Data Sources
The Tableau Server repository (Postgres), also known as the workgroup database, stores all the metadata about your server’s content. By connecting to this database, you can access relevant information.
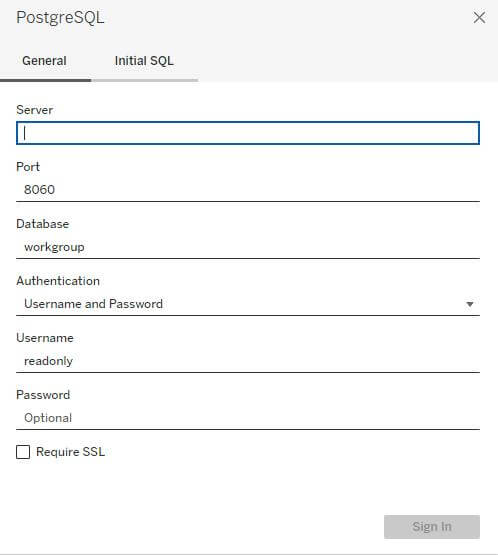
- Connect to the PostgreSQL server and enter the relevant information, such as the server name, username, and password.
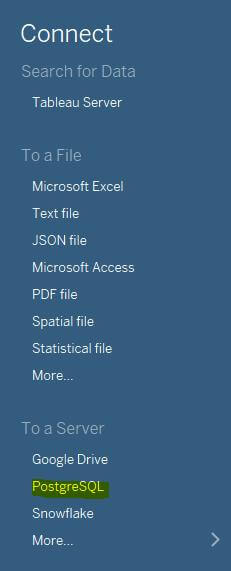
- The tables to be used are as follows:
_workbooks: Information about all workbooks.
_views: Details about views, including dashboards and sheets.
_datasources: Information about published data sources.
_historical_events: Logs about user interactions and content usage.
_users: Data about users who have access to the server.
_projects: Information about the organization of content into projects.
Dashboard Development
Below are the steps to create a calculated field:
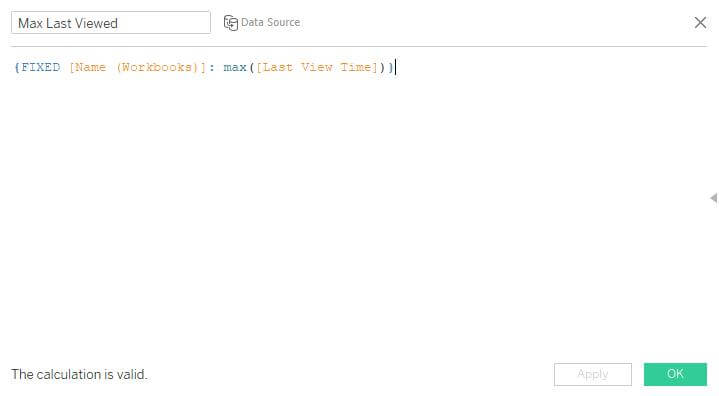
Step 1
Create a calculated field to determine the maximum last viewed time for each workbook.
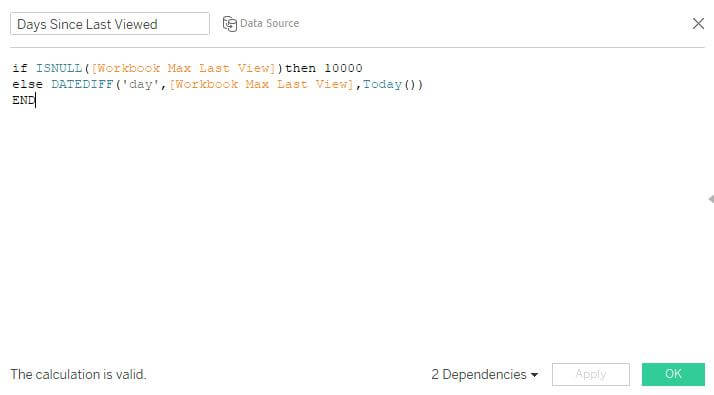
Step 2
Calculate the difference between the last viewed date and today’s date in days.
Step 3
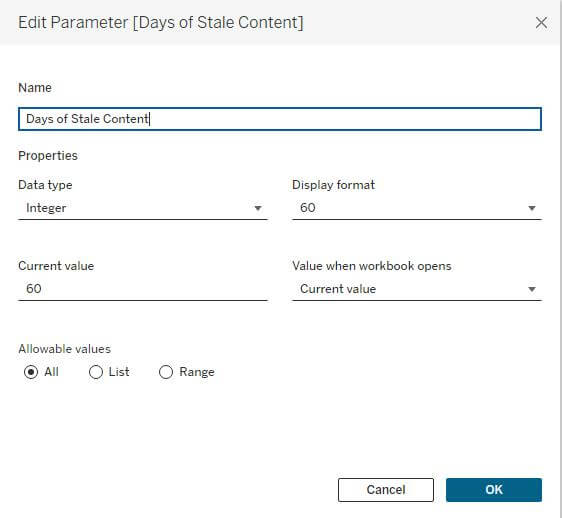
Create an integer parameter to dynamically enter the number of days for stale content.
Step 4
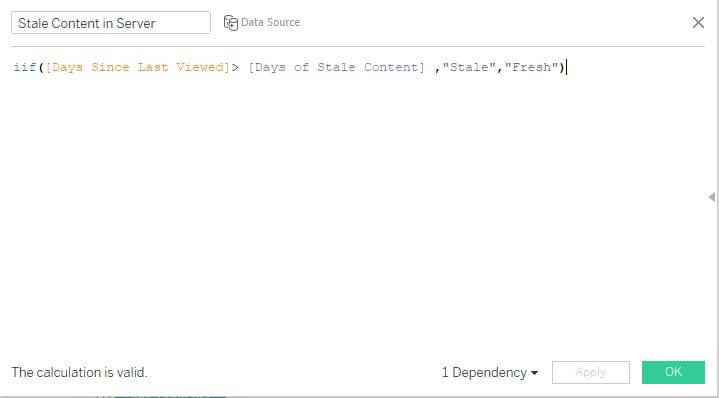
Compare the last viewed date with the date entered through the parameter.
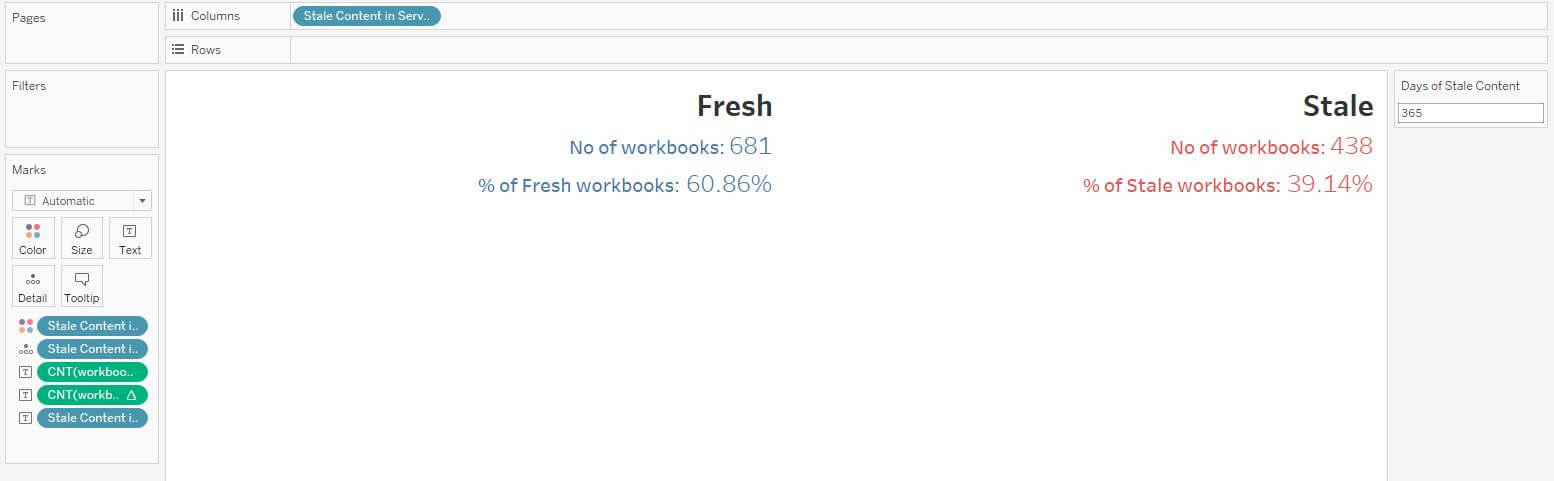
Add the stale content calculated field to the column shelf and the workbook count to the text shelf. Use a table calculation to determine the percentage.
This shows the stale content and fresh content over the past 365 days.
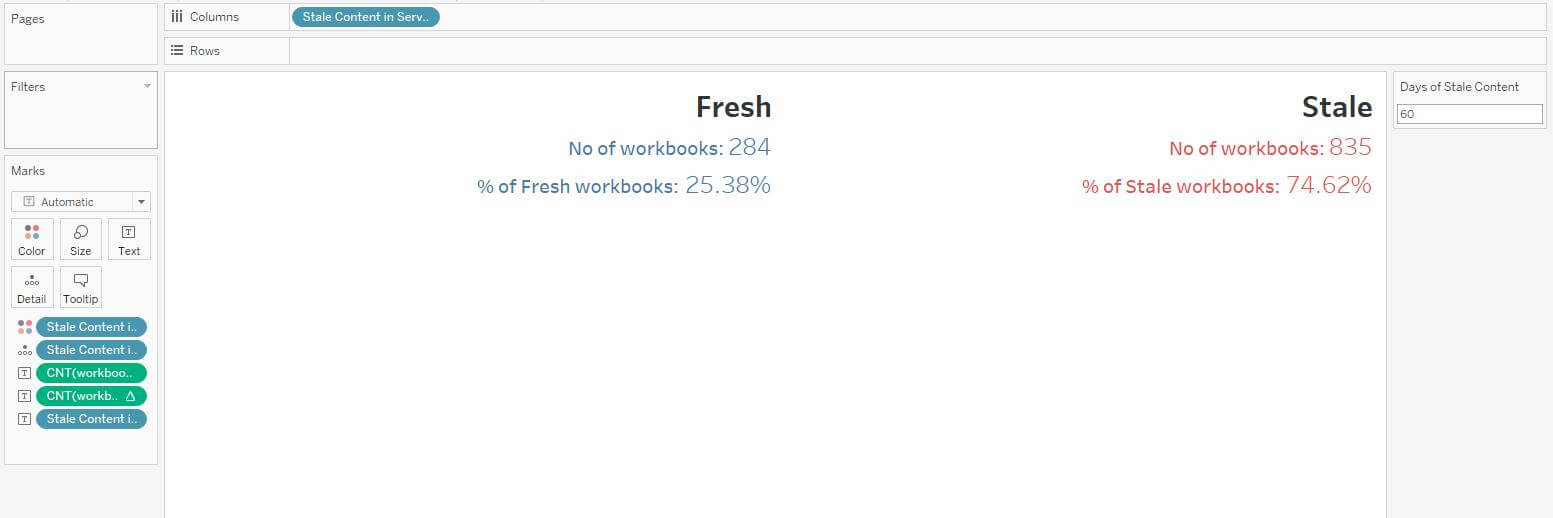
Step 5
As you adjust the parameter, the content information updates accordingly.
Step 6
You can drill down further to identify the project name, workbook name, and owner name for detailed analysis by creating a dashboard action filter that redirects to the detailed view.
Keeping your Tableau Server content clean and relevant is essential for optimizing performance and ensuring users access the most up-to-date data. By building a Stale Content Identification Dashboard, you can easily track workbooks, views, and data sources that are no longer in use or haven’t been updated in a long time.
This dashboard allows administrators to take a proactive approach to managing content and allowing them to declutter their Tableau Server environment and maintain a streamlined, efficient system.