Harnessing Snowflake Semi-Structured Data in Tableau: A Comprehensive Guide
Integrating Snowflake Semi-Structured Data with Tableau: Best Practices Unveiled
Exploring the Power of Snowflake and Tableau Integration for Semi-Structured Data Analysis
Nowadays the amount of semi-structured data used is significantly higher compared to the previous decade. This is because the value of information being derived from data provides more insights, and these insights help businesses make informed decisions. Therefore, it becomes important to efficiently load data that is used for analysis.
1. How Semi-structured data is stored in Snowflake?
The support for semi-structured data that includes flexible-schema data types for loading the data without transformations is provided by Snowflake. The following data types: Variant, Object and Array are used to signify arbitrary data structures. Based on this we could import and operate on semi-structured data. This data is provided in semi-structured data formats such as JSON, Avro, ORC, Parquet, and XML which have flexible schemas.
A variant in Snowflake can store values of any data type up to a compressed size of 16MB including objects and arrays. The Semi-structured data can be loaded as a variant type which is stored as separate physical columns in Snowflake. The data stored can then be loaded to Tableau for further analysis
Understanding Snowflake Semi-Structured Data
Step-by-Step Guide: Using Snowflake Semi-Structured Data in Tableau
Best Practices: Optimizing Snowflake and Tableau Integration for Semi-Structured Data
Real-World Examples: Leveraging Snowflake Semi-Structured Data with Tableau
Introduction to Snowflake Semi-Structured Data
Integrating Snowflake with Tableau: Setting Up Your Environment
Analyzing Semi-Structured Data: Techniques and Strategies in Tableau
Enhancing Visualization: Tips and Tricks for Snowflake Semi-Structured Data in Tableau
2. Loading Data in Snowflake
The JSON file that contains the data can be loaded in Snowflake storage using the following steps:
Login to your Snowflake and create a database and schema either using GUI or query.
- Create database DB_NAME.
- Create schema SCHEMA_NAME.
Regardless of the data stored internally or externally, the location where the data is stored is known as ‘Stage’. We must create a stage to store our data to be analysed.
- Create a stage “DB_NAME”.” SCHEMA_NAME”.” STAGE_NAME”
- Create File Format with data type JSON. Since the Semi-structured data that is used here is of the JSON format. Use the ‘CREATE’ option under the File Formats tab.
3. Flatten the data
Now we have our data in a single column variant. We need to view the data in a structured format. Flatten is a table function that is used to convert the Semi-structured data to a relational table structure. The data with type Variant can be given as input through an expression. This eliminates the need for an explicit reference for the array locations.
To query the values in a Semi-structured dataset loaded into the table, enter the below SQL code
Select * from TABLE_NAME, lateral flatten(input=>VariantColumn.array_pointer)Accessing semi-structured data from Tableau
Tableau does not recognize the VARIANT data type, so it doesn’t automatically create queries with the SQL extensions outlined above. This means you must manually create the SQL necessary to access the data in these columns. One way to access semi-structured data is to use custom SQL. Be sure to follow the best practices for using custom SQL described earlier. Specifically, don’t use a monolithic statement that joins across multiple tables. Instead, use a discrete statement to reference the key-value pairs from the VARIANT column and then join that custom SQL “table” with the other regular tables. Also remember to select Assume Referential Integrity in Tableau so the query generator can cull tables when they are not required.
1. Custom SQL using Snowflake Semi-Structured data in Tableau
The Custom SQL feature in Tableau can be used to write a SQL query to retrieve the relevant data. This is most useful when you know the specific data required for analysis which saves a lot of effort.
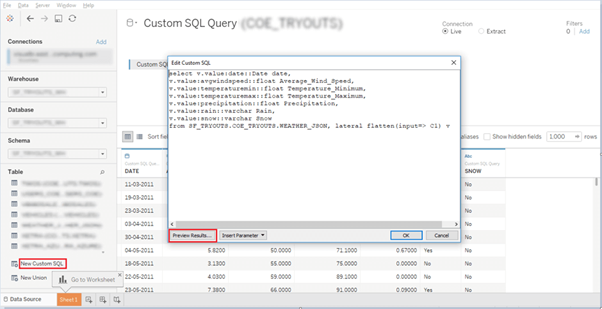
Connect Tableau to Snowflake and drag/click the ‘New Custom SQL’ option which automatically opens a dialog box where the custom SQL can be written. The results of the query can be previewed using the ‘Preview Results’ option.

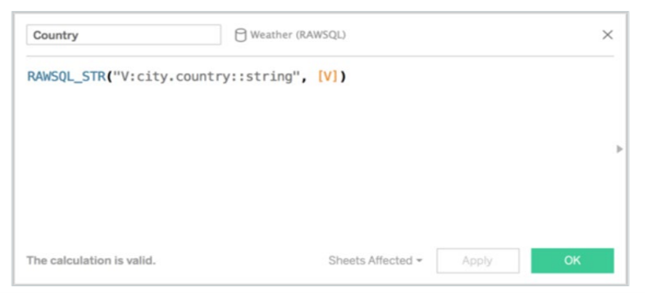
The Snowflake stores semi-structured data into a single column of a special type: VARIANT. Each VARIANT column can contain an entire semi-structured object consisting of multiple key-value pairs. In Tableau, these VARIANT columns can be accessed by RAWSQL functions.
2. RAWSQL
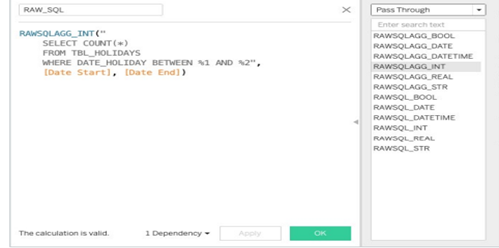
Tableau provides several functions called RAWSQL, that enable passing SQL queries to process underlying data sources. RAWSQL function help to access additional functionality such as high-level language or user-define function.
Snowflake UDF can be addressed with RAWSQL in Tableau.

The RAWSQL functions dynamically extract values from a VARIANT field.

Why Snowflake + Tableau?
Tableau connects to various types of data sources ranging from text files to various databases using its ODBC connector. It has the capability to connect to various servers. Snowflake + Tableau enables swift exploration of datasets and analyses them to arrive at data-driven decisions. Snowflake makes working with Tableau easier, accounting for faster query timing, query cache and handling of semi-structured data. The interactive and user-friendly approach of Tableau to analytics helps leverage Snowflake’s speed to a great extent.
When deployed together, Tableau and Snowflake can help in delivering a scalable, flexible, and simple analytics platform.
Read the article of this series – Design efficient Tableau Workbook with Snowflake Data Sources


 Media Coverage
 Press Release
