Mastering Data Transformation: Creative Strategies for Pivoting Data
Thinking Outside the Box: Alternative Approaches to Data Pivoting
Reshaping Your Data for Analysis: Innovative Techniques for Data Transformation
Introduction
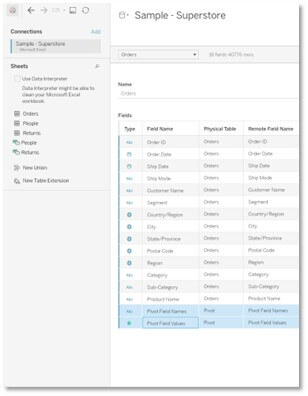
When we work with Excel or text files, we may have often pivoted our dimensions or measures in the data source before proceeding further.
Pivot Date Dimensions:
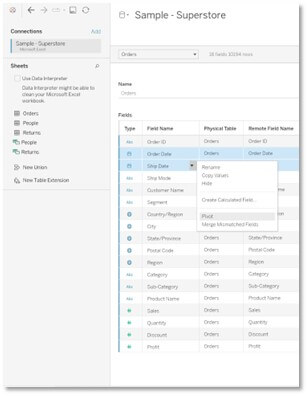
Result of Pivoted Date Dimensions:
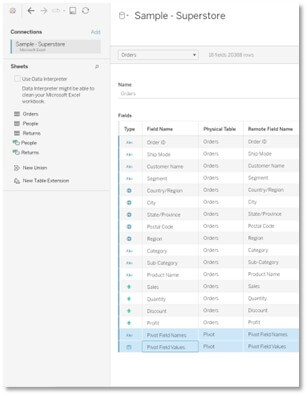
Pivot Measure Values:
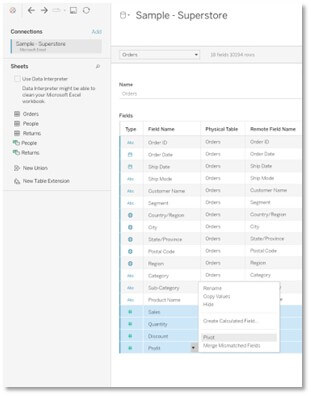
Result of Pivoted Measure Values:
Understanding the Limitations of Traditional Pivot Functions
Creative Solutions for Pivoting Data in Tableau and Power BI
Leveraging Advanced Data Transformation Techniques for Effective Analysis
Case Studies: Real-world Examples of Non-traditional Data Pivoting Scenarios
Exploring Transpose and Unpivot Functions in Tableau and Power BI
Using Custom Scripts and Calculations for Dynamic Data Reshaping
Overcoming Data Structure Challenges: Strategies for Handling Complex Data Formats
Best Practices for Efficient Data Reshaping and Analysis in Tableau and Power BI
Alternative Approach: Using Joins and Calculated Fields
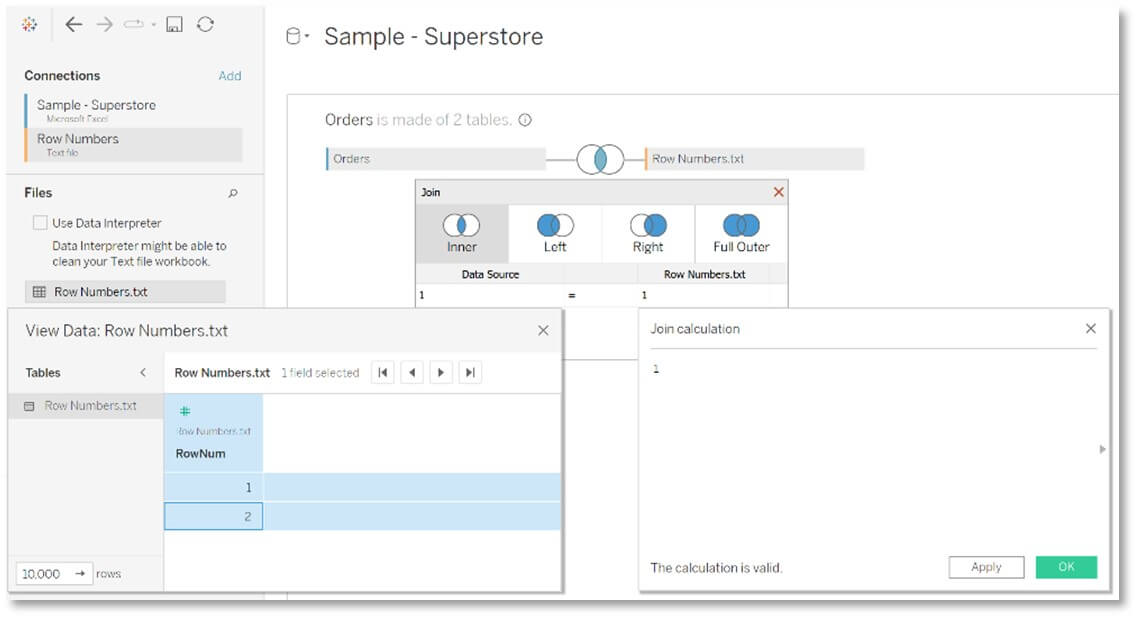
But what do you do when you cannot pivot your data columns? You may be able to achieve the same results with joins. (Note: As of release 2022.4, Tableau does not allow joins with published data sources. If you have published data sources and need to pivot, you can achieve it using Tableau Prep.)
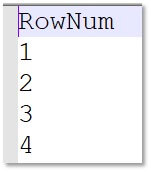
Depending on the number of columns you need to pivot, you can create a file with a list of numbers and use it to do a calculated join with your data. For our above scenarios, this is how we would proceed.
Creating a File for Pivoting Date Dimensions
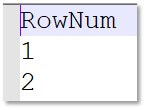
Performing a Calculated Join
File content for pivoting the measure values:
Join the data using a calculation as shown below:
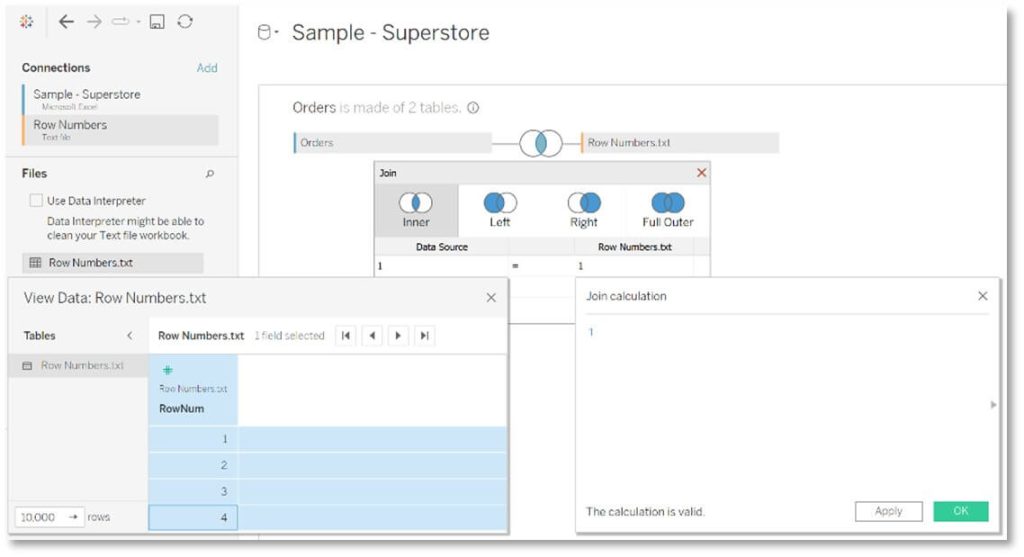
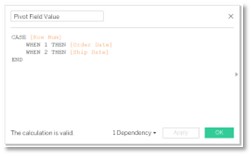
You can now create calculated fields referencing the row numbers to assign the field names and values as desired.
Creating Calculated Fields for Date Dimensions
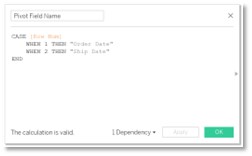
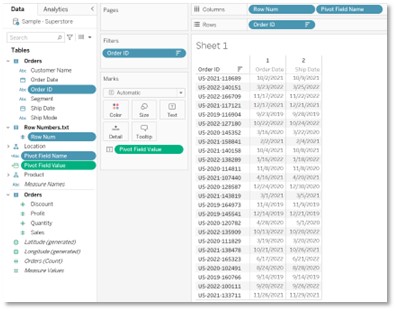
Data displaying the top 25 orders by profit:
Create Calculated fields for the measure values:
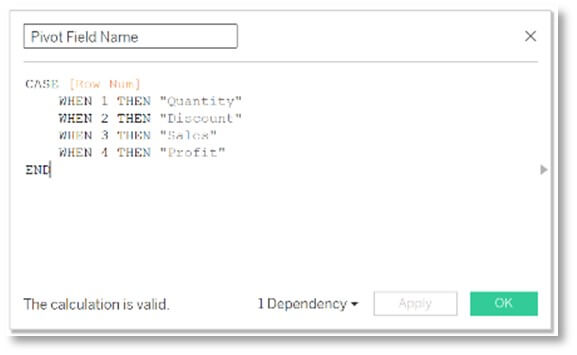
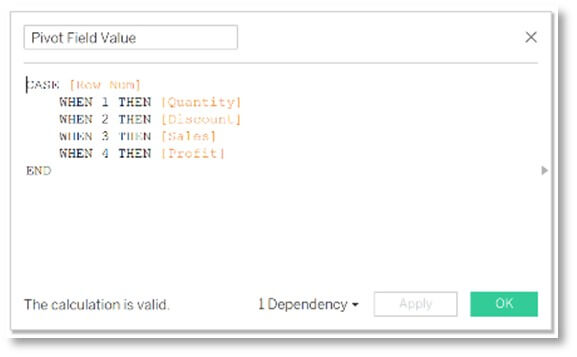
Data displaying the top 25 orders by profit:
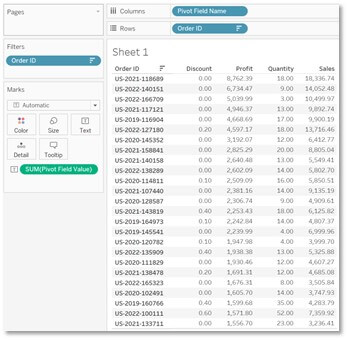
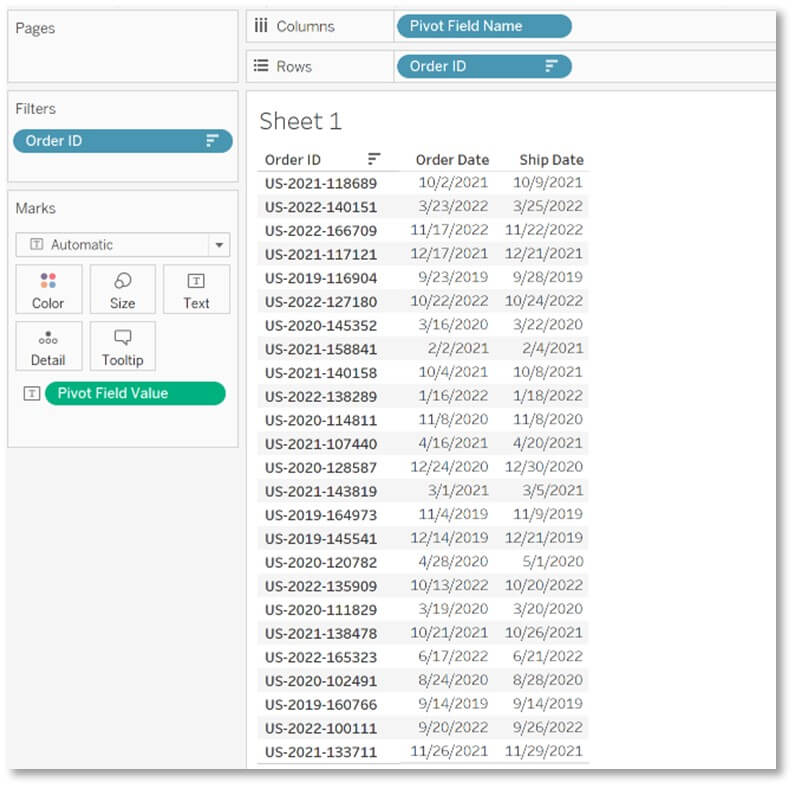
Top 25 orders by profit displaying the date dimensions that were pivoted using joins:
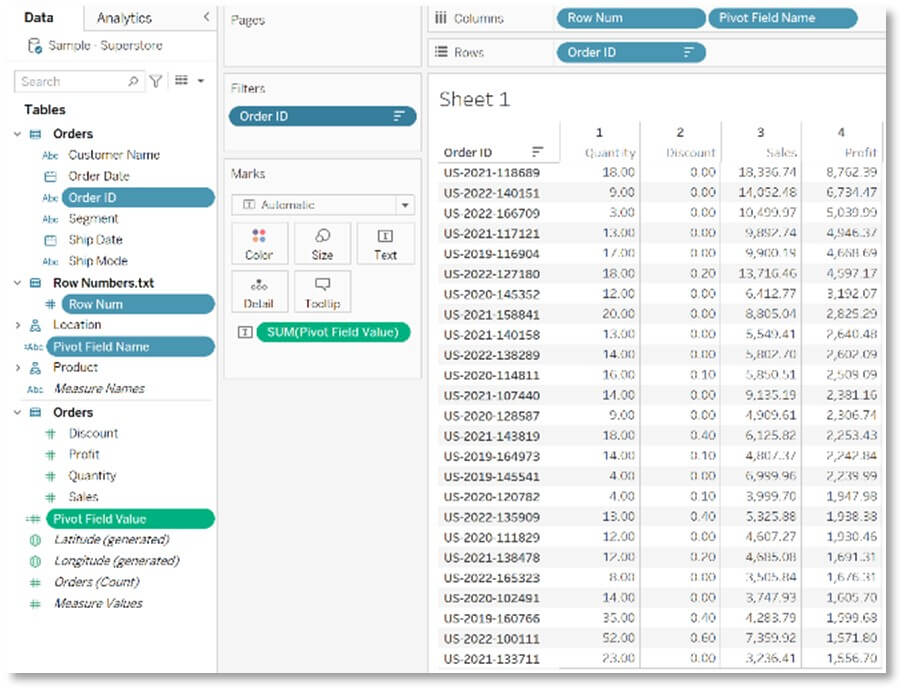
Top 25 orders by profit displaying the measure values that were pivoted using joins:
