 Media Coverage
 Press Release
Understanding Relationships and Joins in Power BI
Step-by-Step Guide to Data Blending
Best Practices for Managing Multiple Data Sources
When to Use Relationships vs. Joins in Power BI
Connecting Tables with Primary and Foreign Keys
Using Power Query for Data Transformation
Optimizing Performance in Multi-Table Models
Understanding Data Relationships in Power BI
Inner Join vs. Left Join – Choosing the Right Approach
Merging Queries for Efficient Data Blending
Common Pitfalls to Avoid When Connecting Multiple Tables
Data blending in Power BI is the process of combining data from multiple sources to create unified reports and visualizations. This can involve merging or appending data from multiple databases, spreadsheets, APIs, or other sources. Power BI provides several ways to blend data, typically through relationships, joins, and appending datasets.
Here are four ways you can achieve data blending in Power BI.
1. Using Relationships (Modeling View)
Power BI allows you to define relationships between tables from different sources, just like foreign key-primary key relationships in a database. These relationships allow Power BI to analyze data across multiple tables without unnecessary duplication.
Detailed Steps
Step 1
Import Data
First, import the datasets from various sources (Excel, SQL databases, cloud services, etc.).
Step 2
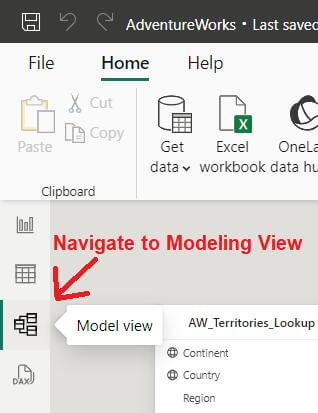
Navigate to Modeling View
Once the data is loaded, switch to the Modeling view by clicking the Model icon on the left panel.
Step 3
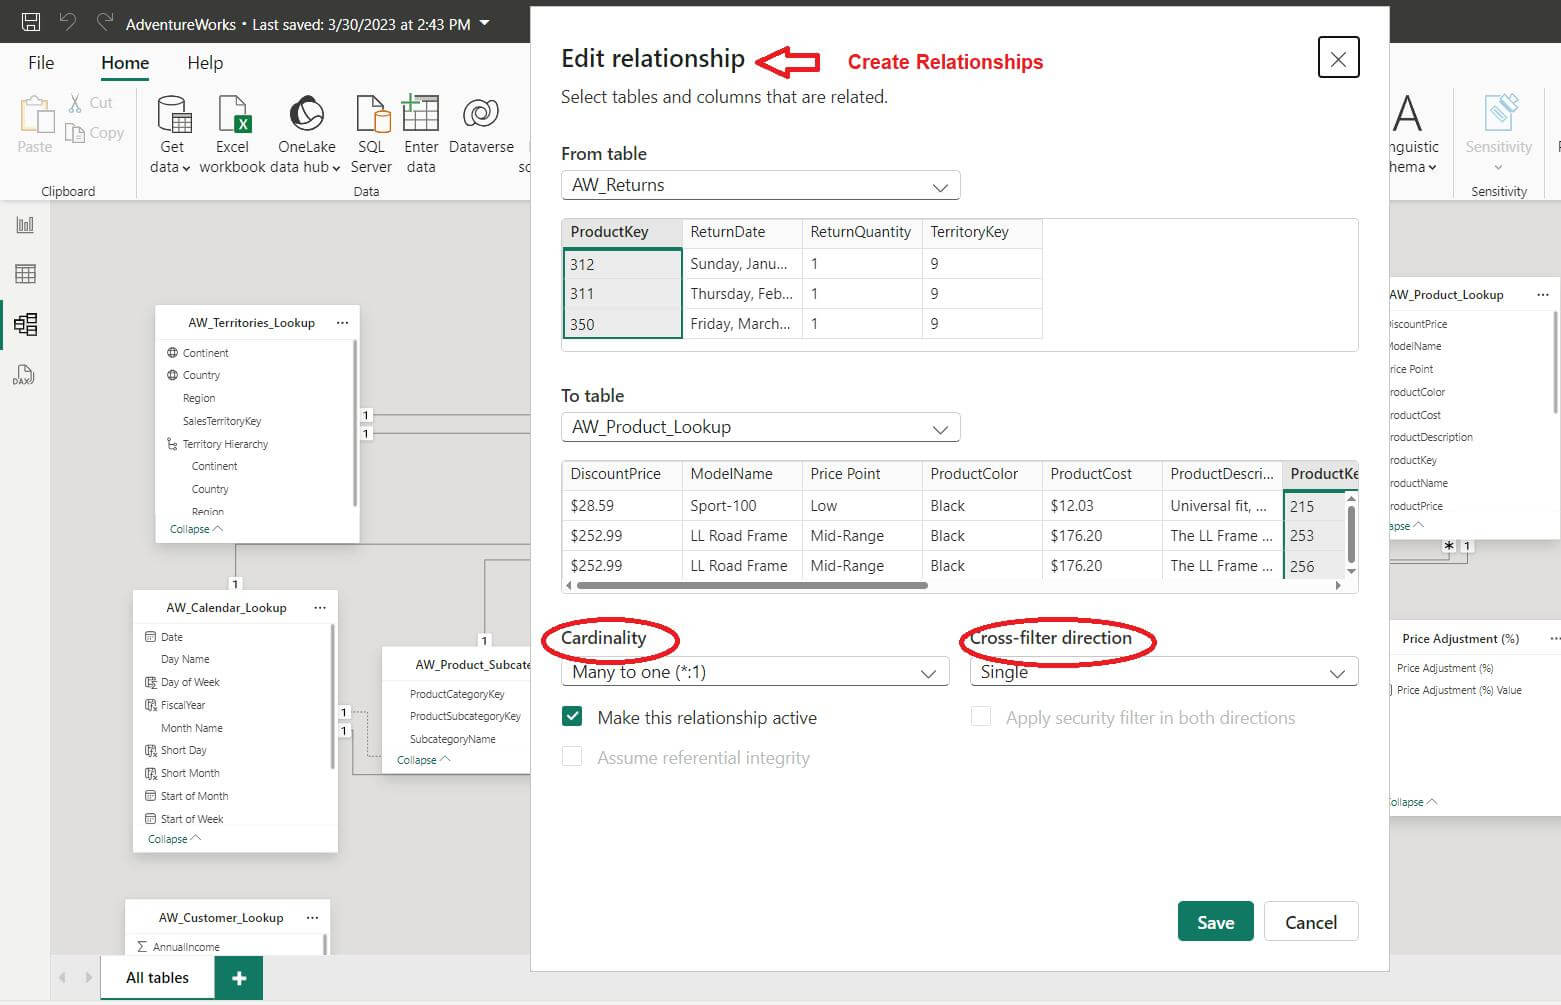
Create Relationships
In the Modeling view, you’ll see tables represented as entities (boxes). You can drag and drop a field from one table onto a field in another table to create a relationship.
Step 4
Cardinality
Set the cardinality of the relationship—whether it’s a one-to-one, one-to-many, or many-to-many relationship. Cardinality affects how Power BI aggregates or relates data.
Step 5
Cross-Filtering
Choose the cross-filter direction (single or both) to specify how filtering from one table will affect the related tables.
Advantages
- Relationships allow you to work with multiple tables in a data model without flattening the data (combining everything into a single table).
- You can create reports that use fields from different tables (such as customer details from one table and transaction data from another) without needing to merge the data into one table.
Example: Imagine you have two tables: Customers (customer details) and Orders (order details). If the CustomerID is present in both tables, you can create a relationship between them. Now, you can analyze total sales per customer without merging the two tables.
2. By Merging Queries (Power Query Editor)
Merging queries in Power BI works like SQL joins. It combines two or more datasets based on matching values (such as IDs or dates) in specified columns.
Detailed Steps
Step 1
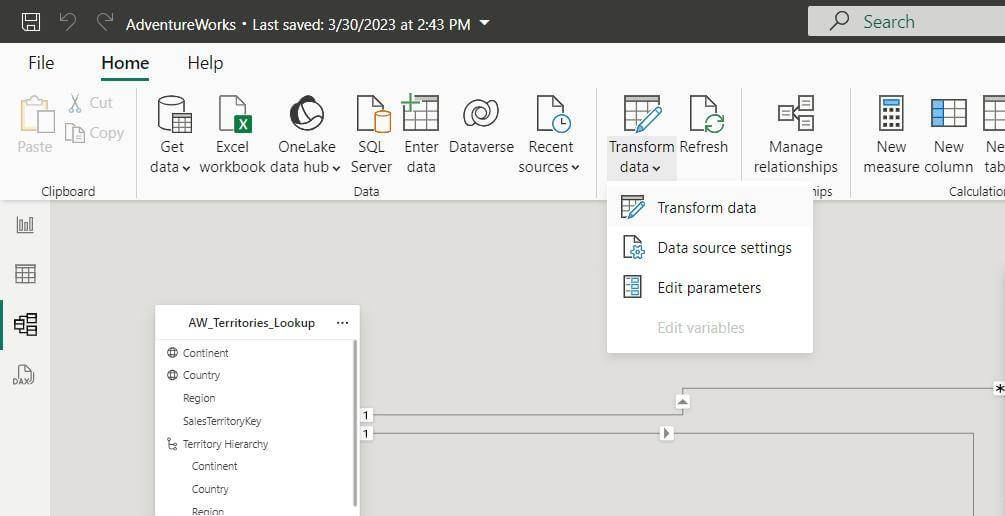
Load Data into Power Query Editor
First, load all the data sources you want to blend into Power BI. Go to Home > Transform Data to open Power Query Editor.
Step 2
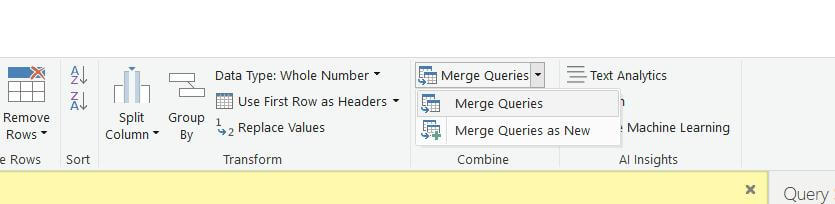
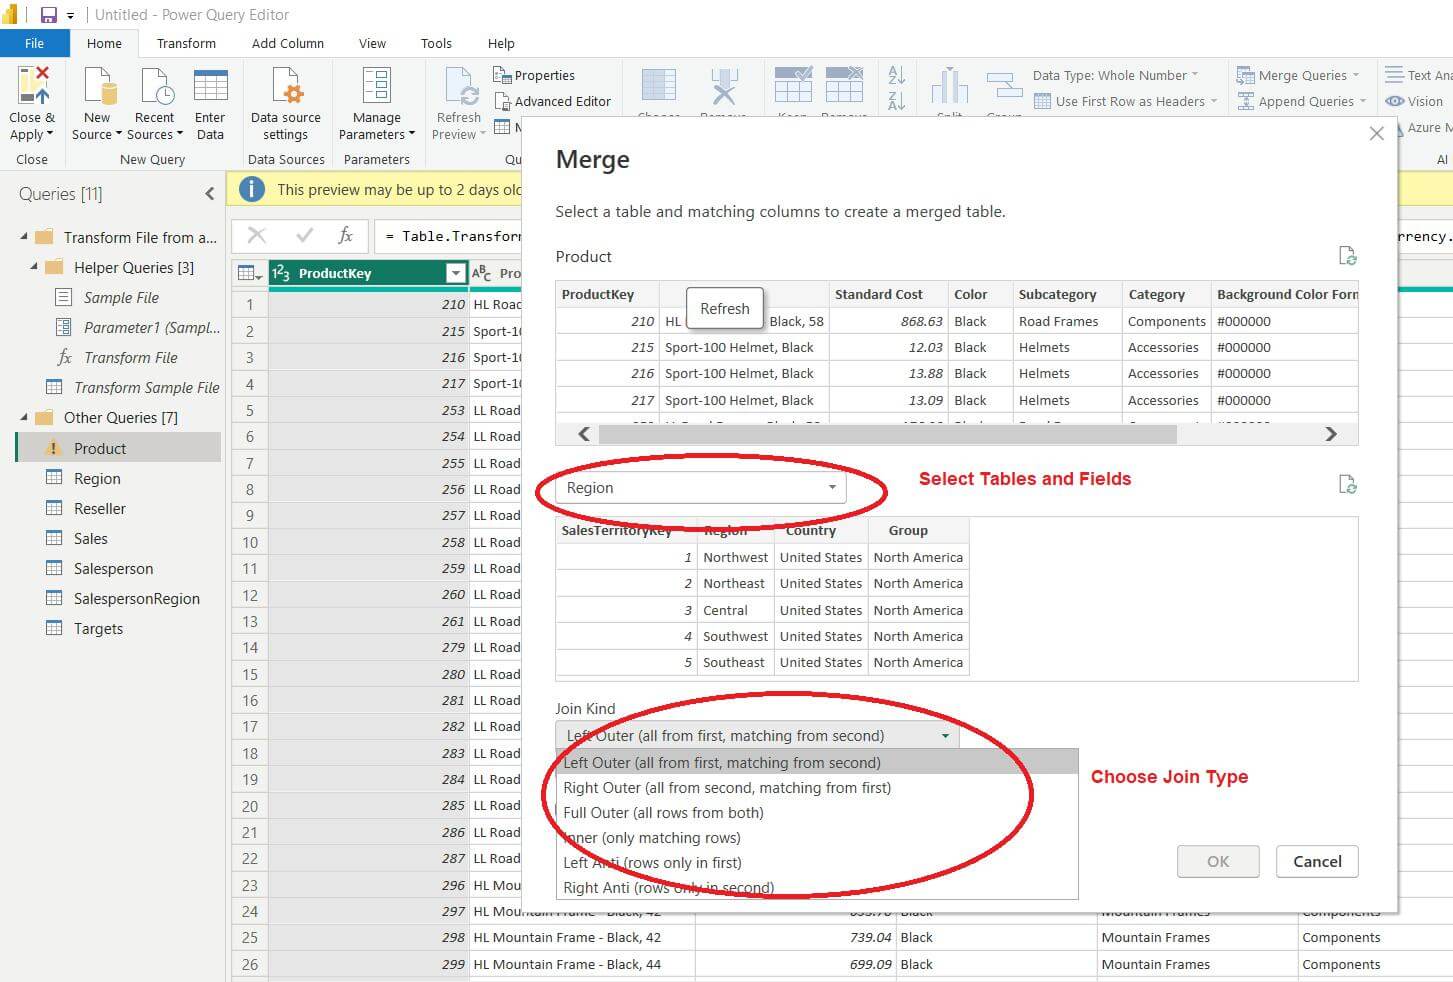
Merge Queries
In Power Query Editor, click on Merge Queries in the Home tab.
Step 3
Select Tables and Fields
Choose the two tables you want to merge. Then, select the fields (columns) that will serve as the join keys (e.g., a CustomerID or Date field).
Choose Join Type
Power BI offers several types of joins:
- Inner Join: Returns only matching rows from both tables.
- Left Outer Join: Returns all rows from the left table and matching rows from the right table.
- Right Outer Join: Returns all rows from the right table and matching rows from the left.
- Full Outer Join: Returns all rows when there is a match in either table.
Step 4
Expand Columns
After merging, you’ll have an option to expand the table and select the columns you want to keep from the merged table.
Advantages
- Merging queries is useful when you have data in separate tables that need to be combined into one for reporting purposes, without the complexity of managing multiple tables in the model.
- You can define exactly how to join tables (inner, left, right, etc.) based on your specific requirements.
3. By Appending Queries (Power Query Editor)
Appending queries is similar to performing a UNION operation in SQL. It stacks datasets on top of each other, provided they share the same structure (i.e., the same columns).
Detailed Steps
Step 1
Load Data
Load the datasets you want to append. These datasets should have similar columns, although Power BI can handle slight mismatches.
Step 2
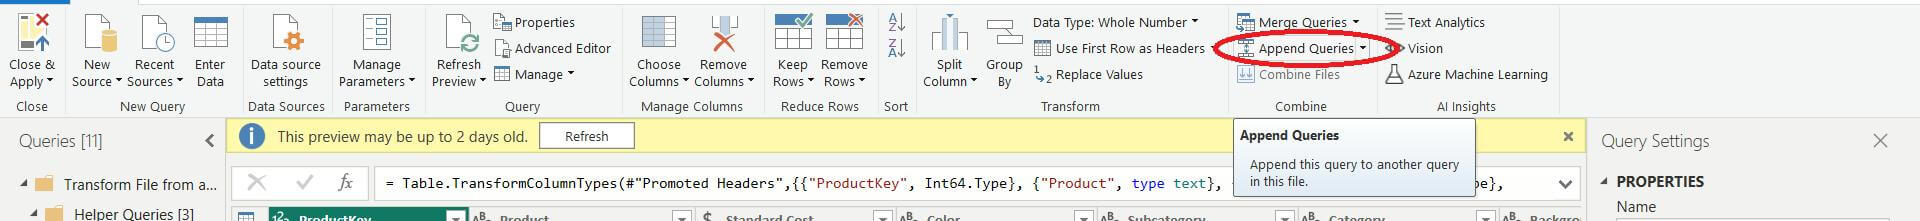
Append Queries
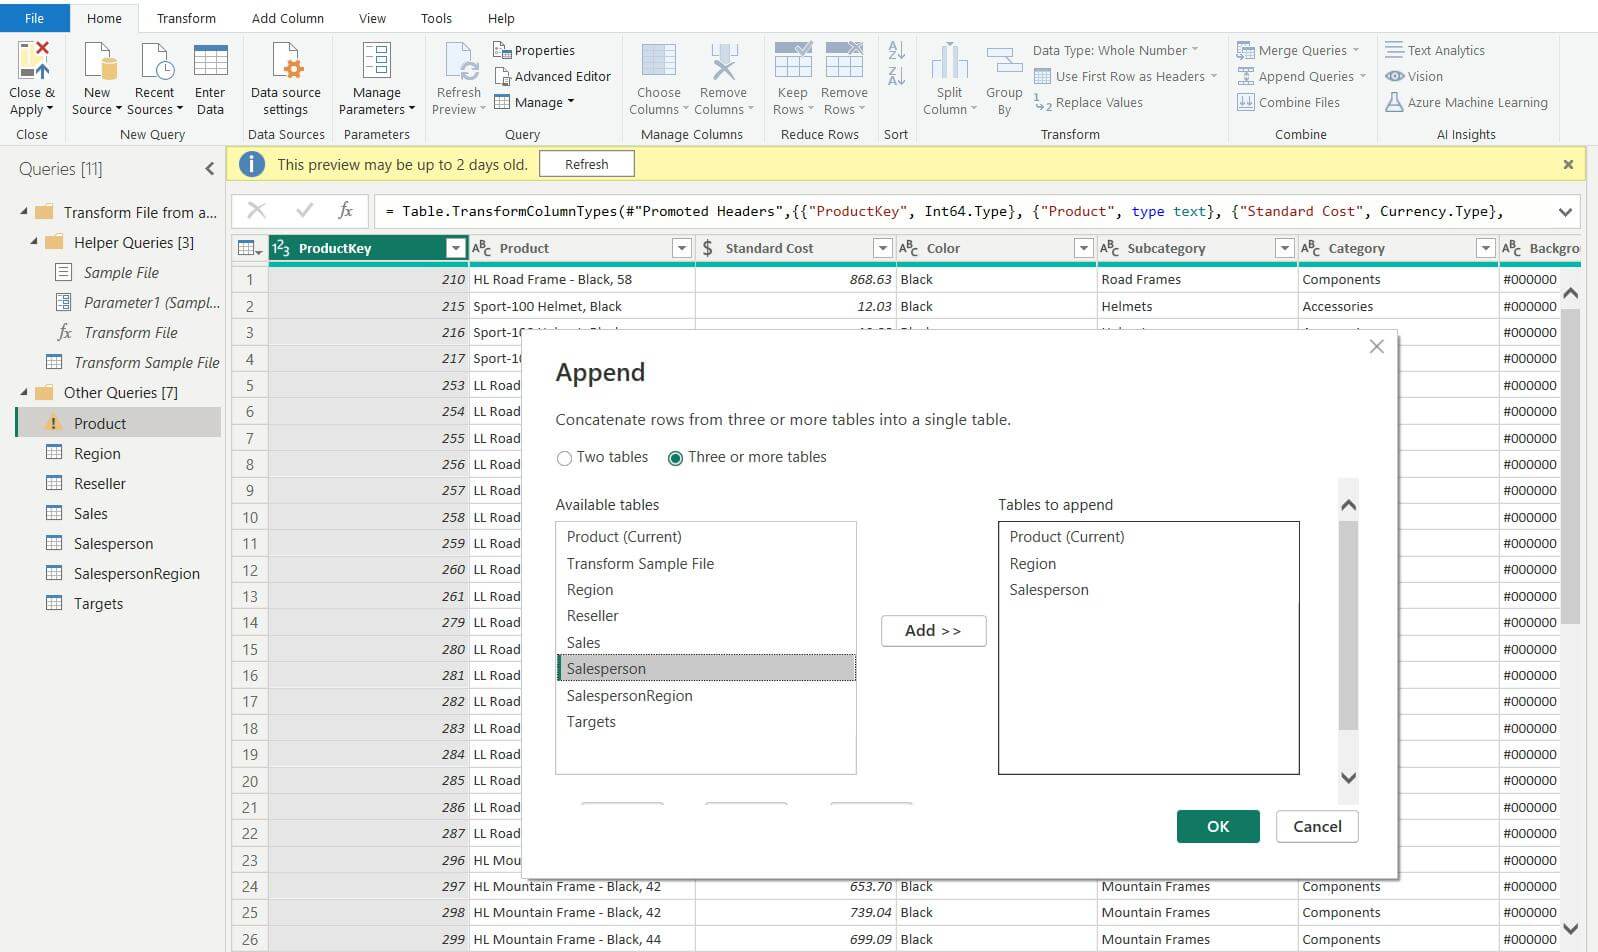
In Power Query Editor, go to Home > Append Queries. Choose whether to append two tables or multiple tables.
Step 3
Select Tables
Select the tables or queries you want to append.
Step 4
Preview Results
Power BI will stack the rows from the selected tables on top of each other, creating a single unified table.
Advantages
- This is very useful when you have the same kind of data spread across different sources, such as regional sales files, quarterly reports, or multiple CSV files.
- You avoid creating many separate tables for each source and instead get a combined dataset that can be easily analyzed.
4. Using DAX Functions
DAX (Data Analysis Expressions) is Power BI’s formula language for creating custom calculations and measures across tables. DAX allows you to create calculated columns and measures that integrate data from multiple tables, even if they are not physically merged.
Key Concepts
- Calculated Columns: These are columns that you add to a table using a DAX formula. They are useful when you need a column that doesn’t exist in the original dataset but can be calculated from other data.
- Measures: These are dynamic calculations that aggregate data (e.g., sum, average) based on filters and slicers applied in your report.
Examples
SUMX
A common DAX function used to perform calculations over a table or a relationship.
DAX

TotalRevenue = SUMX(Sales, Sales[Quantity] * Sales[Price])
This formula calculates the total revenue by multiplying quantity and price for each row in the Sales table.
CALCULATE
Used to modify the context in which a DAX expression is evaluated. For example:
DAX

FilteredSales = CALCULATE(SUM(Sales[SalesAmount]), Sales[Region] = "North")
This measure calculates total sales, but only for the North region.
SUMMARIZE
Creates summary tables by grouping data and calculating aggregates.
DAX

SalesSummary = SUMMARIZE(Sales, Sales[ProductID], "Total Sales", SUM(Sales[SalesAmount]))
This formula groups sales data by ProductID and calculates the total sales for each product.
Advantages
- DAX allows for advanced data manipulation and modeling without altering the underlying data structure.
- You can combine data from multiple tables that have relationships defined in the model, making it easy to create dynamic, interactive reports.
Example
- If you have a Sales table with transaction details and a separate Products table with product details, you can use a DAX measure to calculate total sales by product category, without having to merge the two tables.
Each data blending method in Power BI serves a specific purpose. Relationships maintain separate data sources while ensuring they interact seamlessly in reports. Merging and appending queries are useful for combining datasets before you build your report. DAX functions allow for advanced calculations that can span multiple tables. Depending on your use case, you can mix and match these approaches to create efficient, interactive, and informative Power BI reports.