 Media Coverage
 Press Release
Crafting Compelling Word Cloud Charts in Tableau: A Comprehensive Guide
Step-by-Step Tutorial: Creating Word Clouds in Tableau for Effective Text Visualization
Mastering Text Data Visualization: Building Word Cloud Charts in Tableau
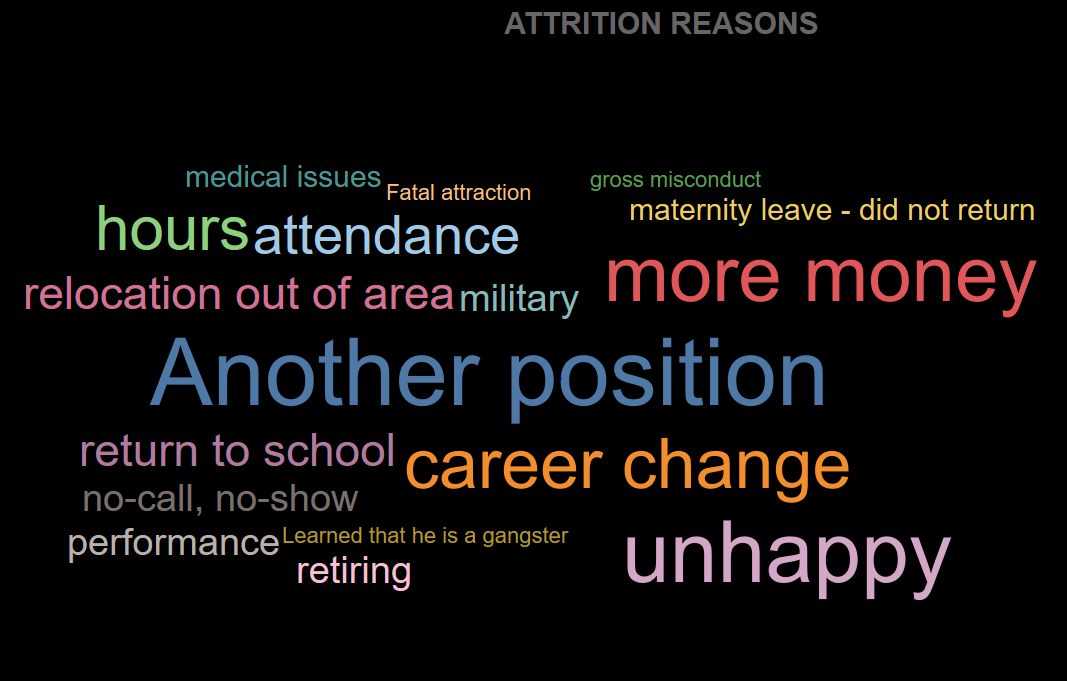
A word cloud (or tag cloud) is a word visualization that displays the most used words in a text from small to large, according to how often each appears.
In this article, I have demonstrated how to build word cloud chart using a HR data sets pre-packaged with Tableau app.
Video Description:
The video includes the step-by-step instruction of building a word cloud chart from the scratch.
Chart Description:
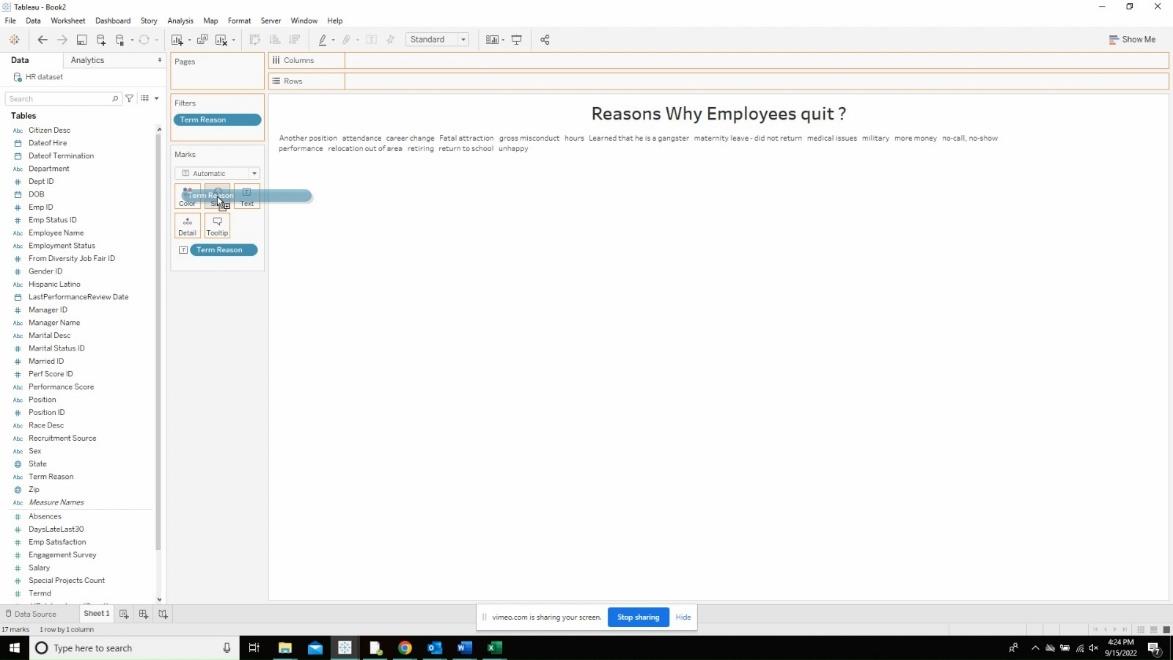
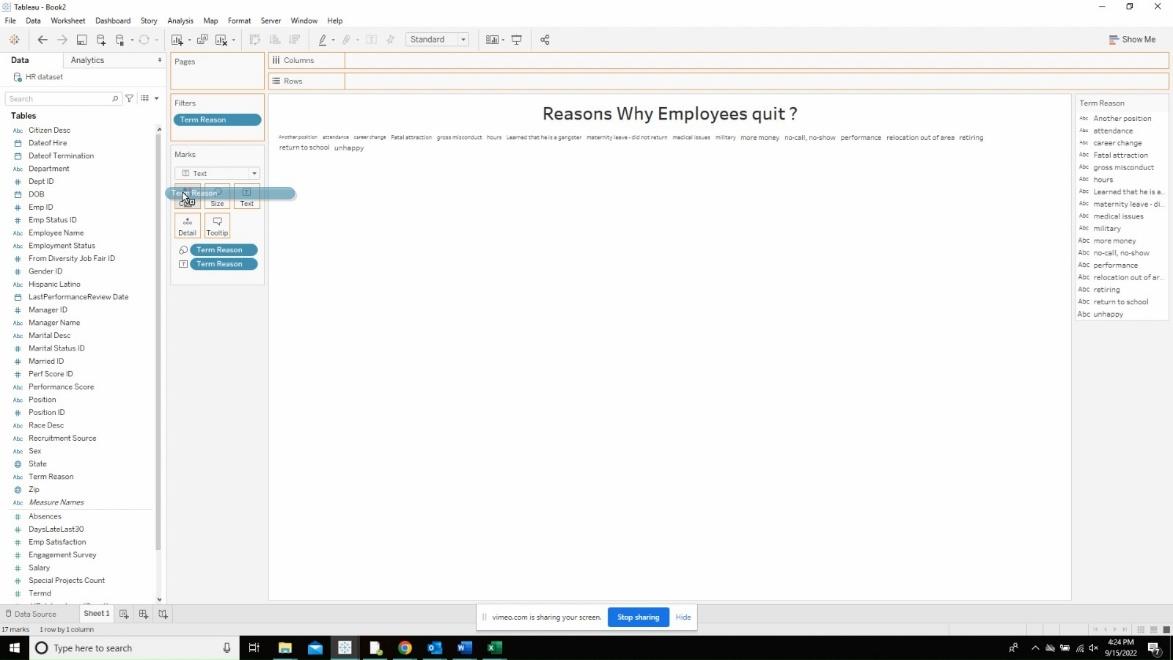
Select the dimension you want to use for the word cloud and drop it on the text part of the marks card.
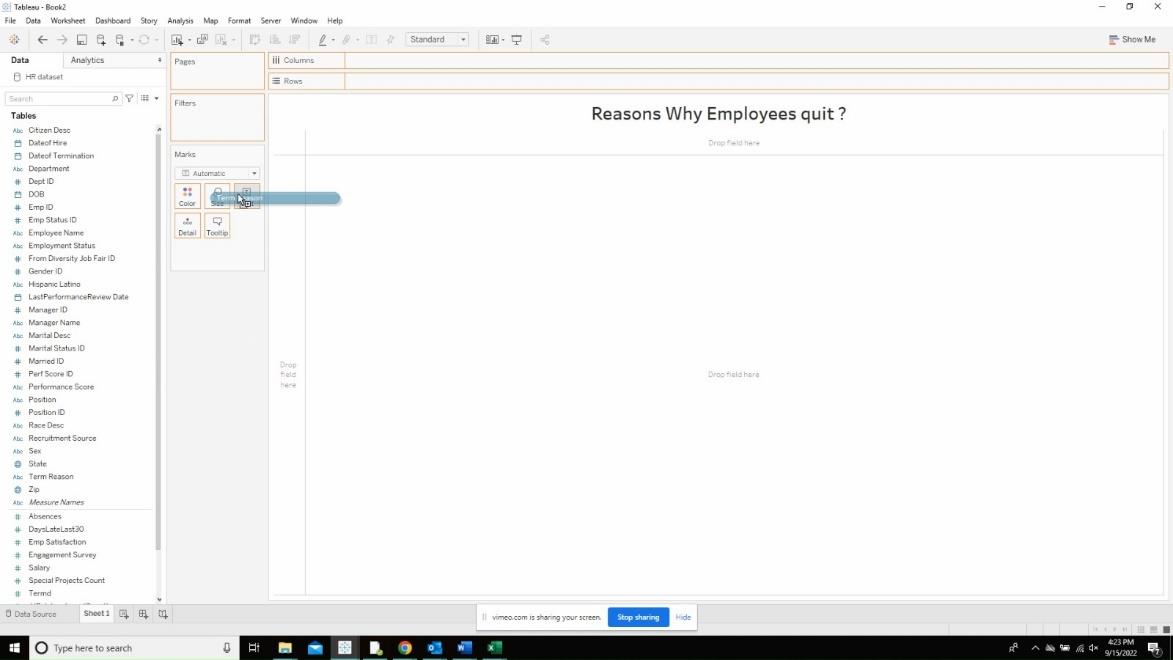
Add the same dimension to the size marks card to make it look like the below.
Introduction to Word Cloud Charts and Their Role in Data Visualization
Step-by-Step Guide: How to Create Word Clouds in Tableau
Best Practices for Designing and Customizing Word Cloud Charts in Tableau
Enhancing Dashboard Insights with Word Cloud Visualizations
Understanding Text Data Visualization: The Power of Word Clouds
Creating Word Clouds in Tableau: From Data Preparation to Visualization
Tips and Tricks for Optimizing Word Cloud Charts in Tableau
Case Studies: Real-world Examples of Word Clouds in Tableau Dashboards
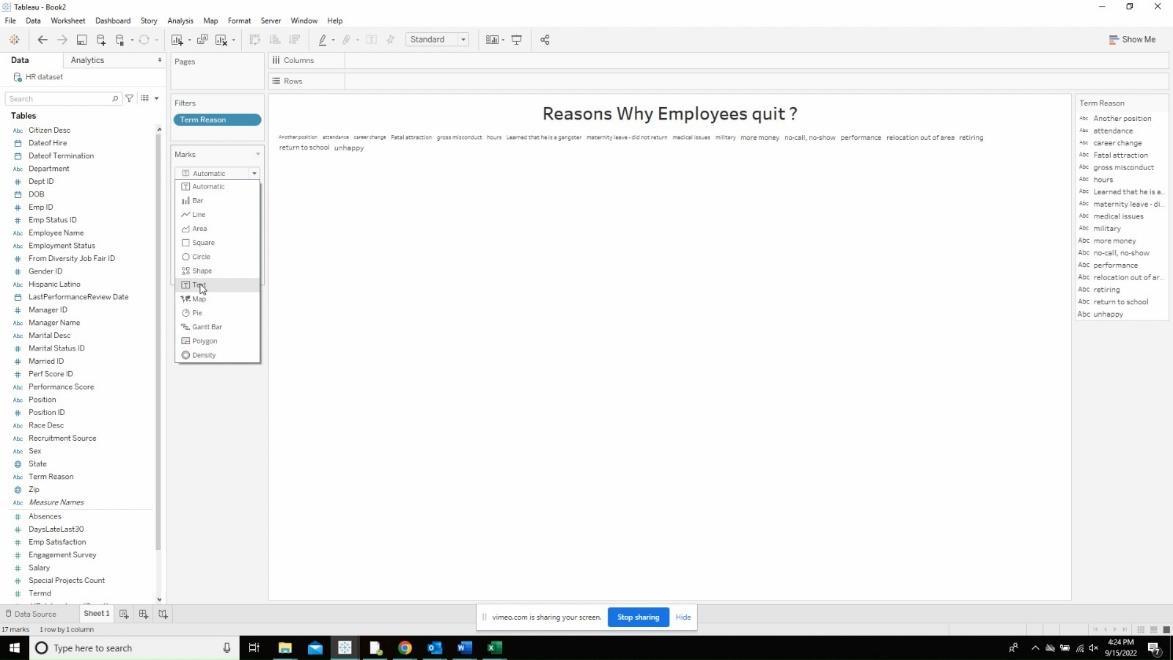
Now, change the automatic to “Text”.
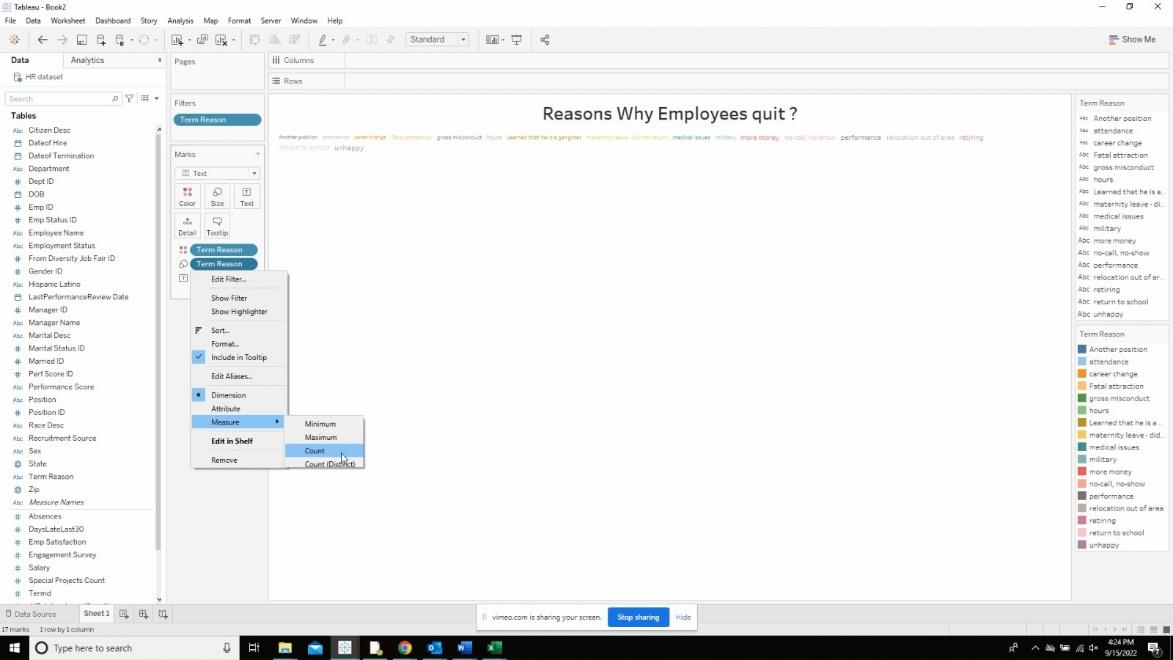
Also, add the dimension to the “Color” marks card to make it look like below.
Click on the drop down of the dimension added in size and choose “Count” from the measure.
The final output should look something like the below.