Crafting Custom Bar Inside Bar Charts in Tableau: A Step-by-Step Guide
Mastering Bar Inside Bar Chart Design: Tips and Techniques in Tableau
Elevating Data Visualization with Custom Bar Inside Bar Charts in Tableau
The bar inside bar is very useful chart when you want to compare two measures or more in a glimpse.
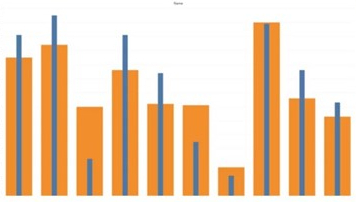
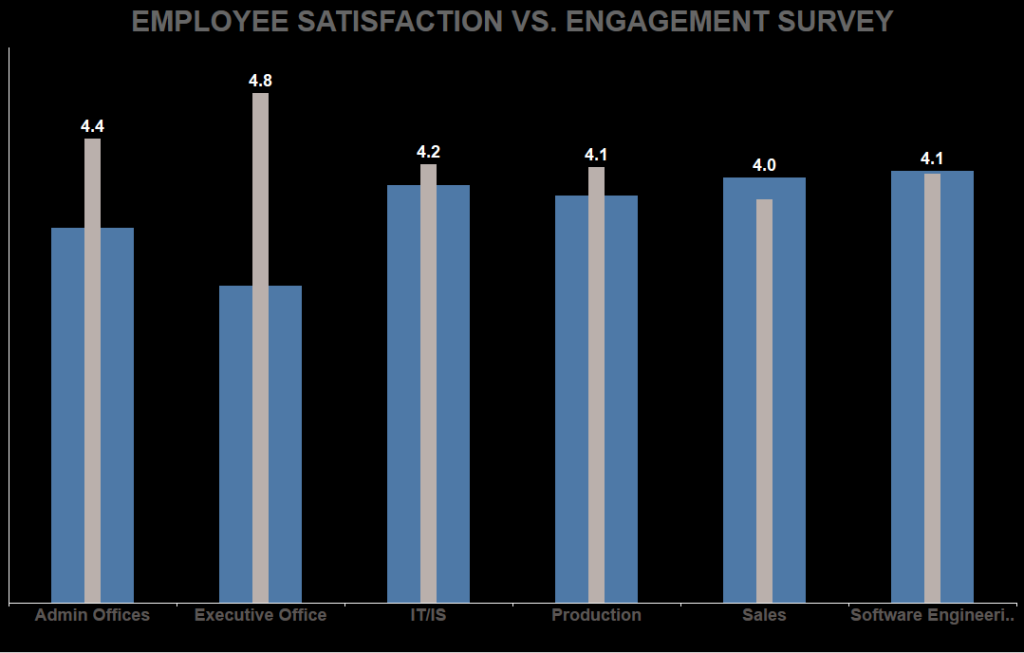
In this article, I have demonstrated how to build a bar in bar chart using a HR data sets pre-packaged with Tableau app. The goal of the bar inside bar charts is to compare two or more measures -the second measure preferably in the background.
Understanding Bar Inside Bar Charts and Their Applications in Tableau
Step-by-Step Guide to Creating a Custom Bar Inside Bar Chart in Tableau
Designing Effective Bar Inside Bar Charts for Data Analysis in Tableau
Tips for Enhancing Bar Inside Bar Chart Visualizations in Tableau
Introduction to Bar Inside Bar Charts and Their Benefits in Tableau
Exploring Advanced Formatting Options for Bar Inside Bar Charts in Tableau
Leveraging Calculated Fields for Custom Bar Inside Bar Charts in Tableau
Best Practices for Designing Interactive Bar Inside Bar Charts in Tableau
Video Description:
The video includes the step-by-step instruction of building a bar inside bar from the scratch.
Chart Description:
STEP 1: Drop the measures next to each other in the rows shelf and drop the dimension you want to view the data by in the columns shelf.
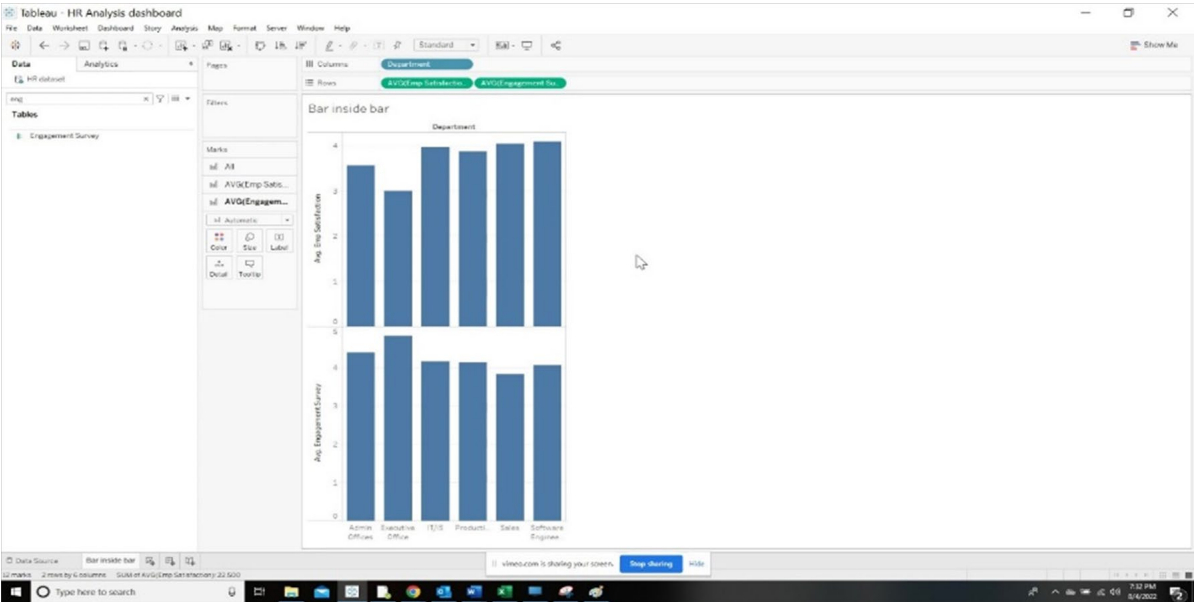
STEP 2: Now, drag the second measure and drop it on the Y axis of the first measure. You will see something like the below viz when you do that.
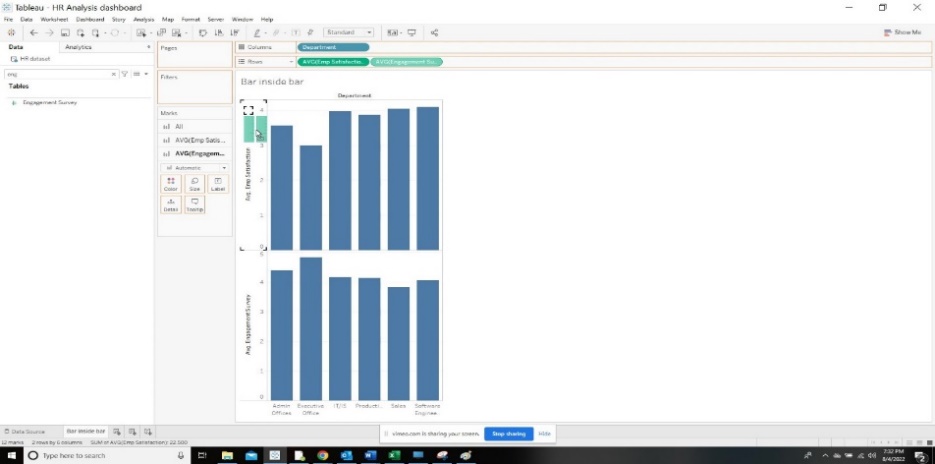
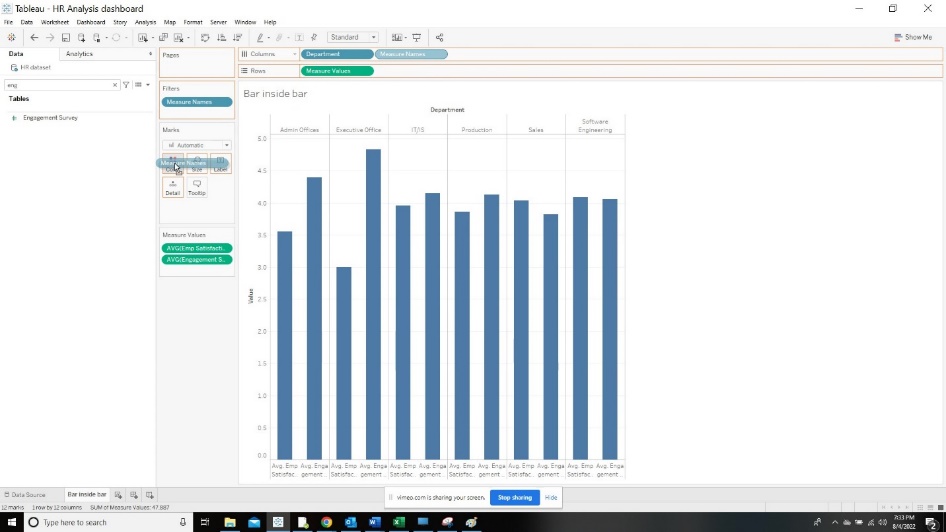
STEP 3: Drag the measure names from the columns shelf and drop it to the color pane under the marks section. Also, drag the measure names to the size section of the marks card.
You should already see a bar placed inside a bar. Now, all we need to do is some formatting which will be all. Start playing with the size of the bars until you reach your desired size.
Rearrange the measure values according to your preference.
STEP 4: Click on the “Analysis” tab on the top and place the cursor on the stack marks. Now you will have to switch it from automatic to “OFF”. The bar inside bar final output will look like below after cleaning up.


 Media Coverage
 Press Release
