
Streamlining Data Preparation with Fuzzy Matching in Tableau Prep
Transforming Messy Datasets for Better Analytics
Enhancing Data Quality with Fuzzy Matching Techniques
Understanding Fuzzy Matching in Tableau Prep
Key Benefits of Using Fuzzy Matching for Data Preparation
Step-by-Step Guide to Implementing Fuzzy Matching in Tableau Prep
Common Use Cases for Fuzzy Matching in Data Analytics
Overcoming Data Challenges with Fuzzy Matching
Best Practices for Data Cleansing in Tableau Prep
Automating Data Matching for Faster Results
Leveraging Fuzzy Matching to Improve Data Accuracy
Imagine wrestling with a dataset so inconsistent that ‘New York’, ‘NY’, and ‘New york’ appear as completely different entities. Every data analyst’s nightmare, right? Enter fuzzy matching – the secret weapon that transforms chaotic data into crisp, actionable insights. Far beyond simple exact matches, this powerful technique uncovers hidden connections in your data, turning messy information into a structured goldmine of intelligence.
What is Fuzzy Matching?
Fuzzy matching, also known as approximate string matching, is a technique used to identify records in a dataset that are similar but not exactly the same. By analyzing the similarity between strings based on factors like character sequence, phonetic similarity, or grammatical structure, fuzzy matching algorithms can identify potential matches.
Where to Use It?
This technique is particularly useful when dealing with data that may contain typos, misspellings, or variations in formatting. Instead of requiring an exact match, fuzzy matching calculates the degree of similarity between two strings and determines if they are likely to represent the same entity. This capability is particularly useful when dealing with noisy or inconsistent data, where exact matches may be difficult to achieve.
Implementing Fuzzy matching in Tableau Prep
Tableau prep provides multiple ways to implement fuzzy matching to group similar values based on their similarity. The most frequent value will be used as the group’s identifier.
Let’s look at each one of them with an example:-
- Pronunciation – To group values based on their pronunciation, use this option. This employs the Metaphone 3 algorithm, which indexes words by sound. It’s ideal for English words, but it’s not available for data roles.
Example – We have a simple dataset containing city names as follows:-
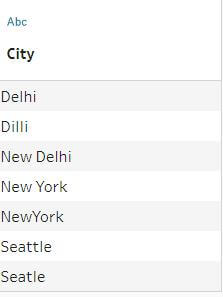
As you can see from the picture above, trying to do any meaningful analysis using City field will result in inappropriate results because of variations in City name.
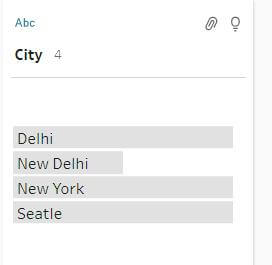
Let’s implement Pronunciation option to group these values.
- In the Profile pane or Results pane, select the field.
- Click More options and select Group Values then select Pronunciation
We will get the following result:
- Common Characters – This option groups values with common letters or numbers using the ngram fingerprint algorithm. This algorithm indexes words by their unique characters and works for any supported language. However, it’s not applicable to data roles. For example, names like ‘John Smith’ and ‘Smith, John’ would be grouped because they both generate the key ‘hijmnost’. However, pronunciation is not considered, so ‘Tom Jhinois’ would also be included in the group.
Example – Running this option on our previous dataset will result in following grouped values:-
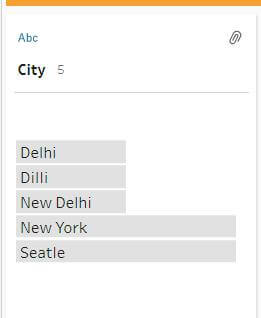
As you can see from results, it only grouped New York and Seatle and left Delhi city variations ungrouped because of difference in common letters and also it does not consider pronunciation.
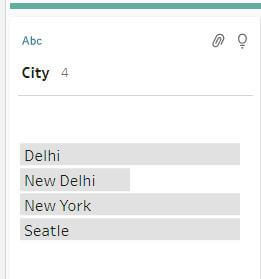
- Spelling – This option groups text values that have similar spelling using the Levenshtein distance algorithm. This algorithm calculates the difference between values and groups them if the difference is below a set threshold. It works for any supported language.
Example – Running this option will result in following values:
- Pronunciation + Spelling – This matching is applicable to data roles. It matches and groups values using the standard value defined for your data role. Invalid values are matched to the most similar valid value considering spelling and pronunciation. If the standard value is absent from your data set sample, it’s automatically added and marked as not in the original data. This option is well-suited for English words.
Adjusting Threshold for Grouping Values
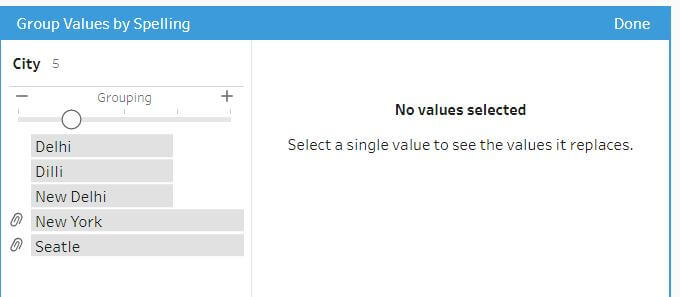
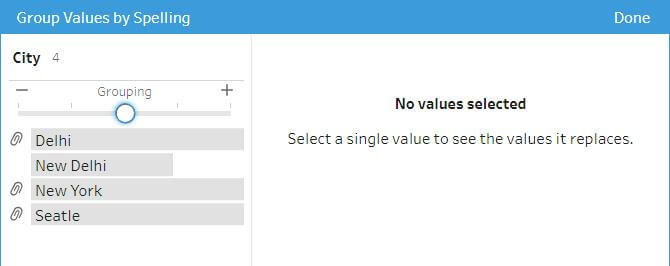
When grouping similar values by Spelling or Pronunciation, you can adjust the grouping strictness using the slider on the field. This allows you to control the number of values included in a group and the number of groups created. By default, Tableau Prep automatically determines the optimal slider position
Example – Grouping data using Spelling method with following threshold configuration will not group Delhi and Dilli.
But increasing the threshold by one unit will group them together.
In summary, Fuzzy matching in Tableau Prep is a valuable tool for effectively identifying and grouping similar data points, even when they have minor differences, improving data quality and enabling more accurate and insightful analyses.


 Media Coverage
 Press Release
