Enhancing Data Visualizations: Hiding Null Values on Differences in Tableau
Optimizing Data Analysis: Techniques for Handling Null Values in Tableau
Mastering Tableau: Best Practices for Dealing with Null Values in Visualizations
We may have all created dashboards with table calculations to look at the difference in sales compared to a previous period.
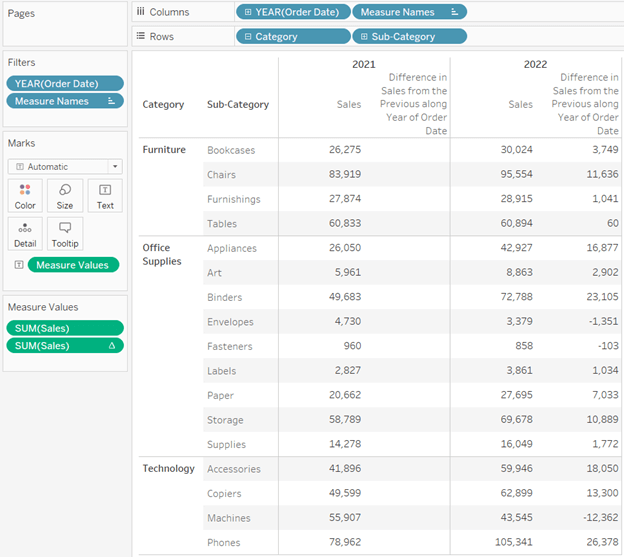
And we would have probably wondered if we can hide the column where the difference is null and tried this.
Understanding Null Values and Their Impact on Visualizations
Step-by-Step Guide: How to Hide Null Values on Differences in Tableau
Tips and Tricks for Cleaner Visualizations: Handling Null Values in Tableau
Advanced Techniques: Customizing Visualizations to Handle Null Values Effectively
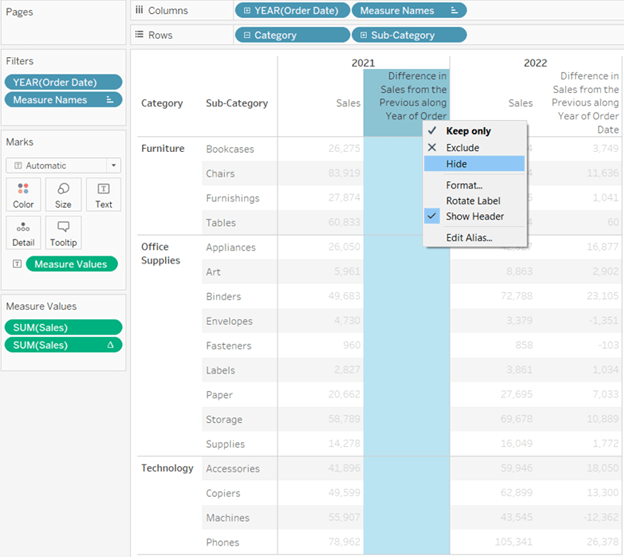
But we are disappointed because we lose the difference completely.
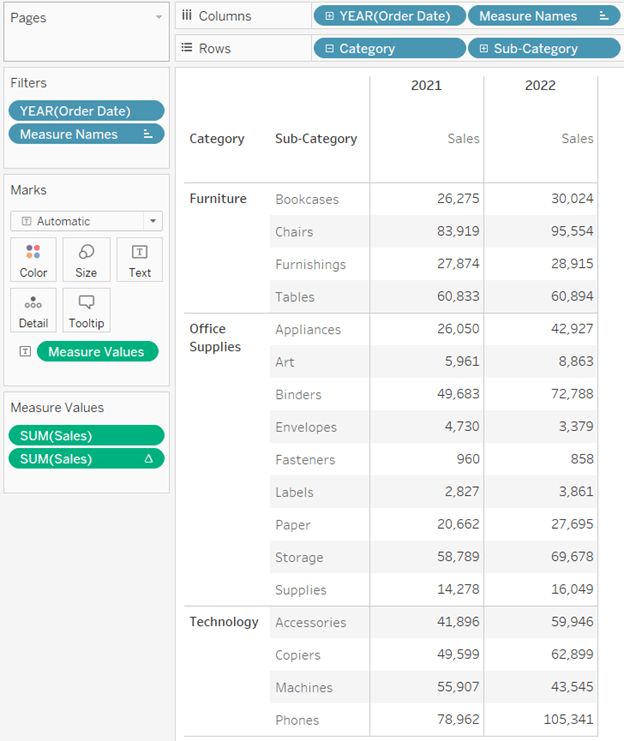
Hence, we revert to the previous view and let the nulls continue to display.
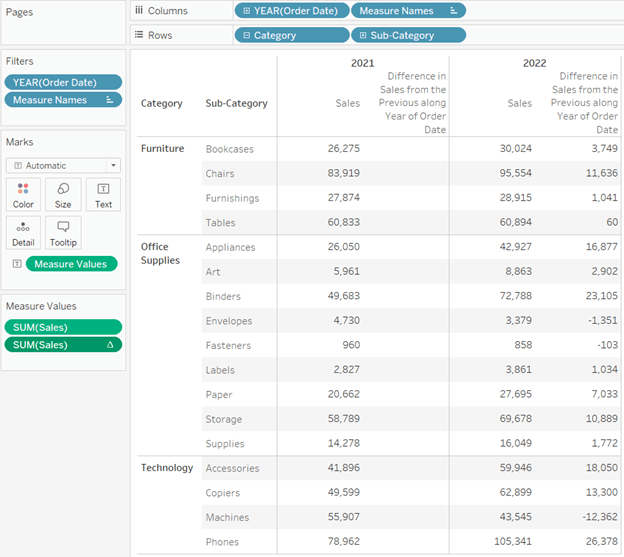
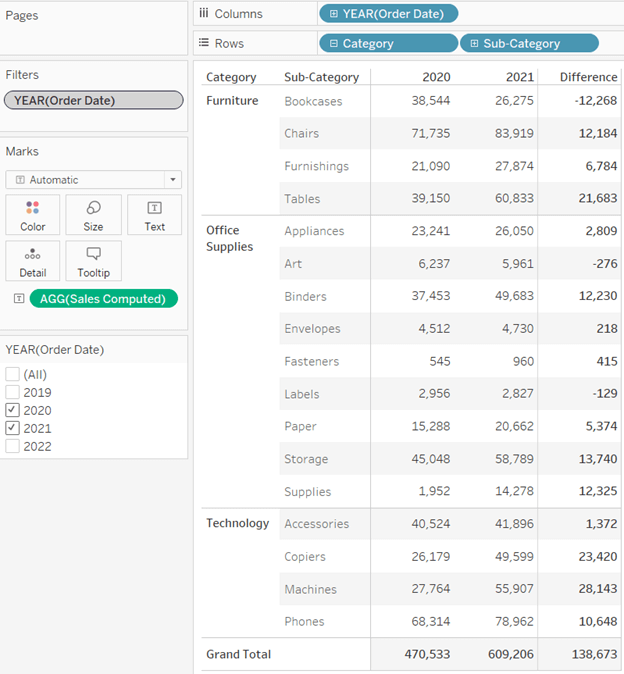
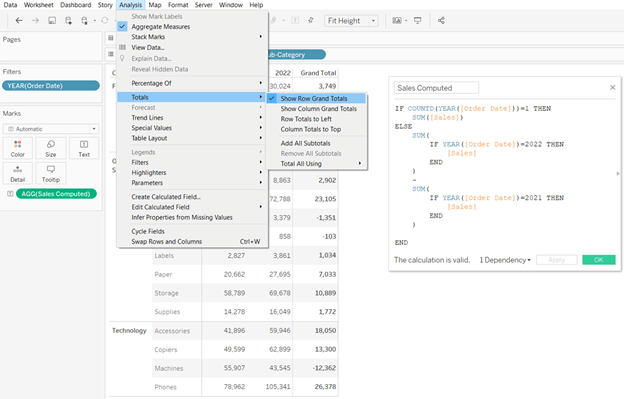
But we don’t need to let it be. We can use the Modify Totals method to display the difference in the total column and not use table calculations.
Identifying Null Values in Tableau: Common Challenges and Solutions
Implementing Conditional Formatting: Strategies for Handling Null Values in Tableau
Enhancing Data Quality: Best Practices for Null Value Management in Tableau Visualizations
Maximizing Insight: Using Tableau’s Features to Address Null Values in Data Analysis
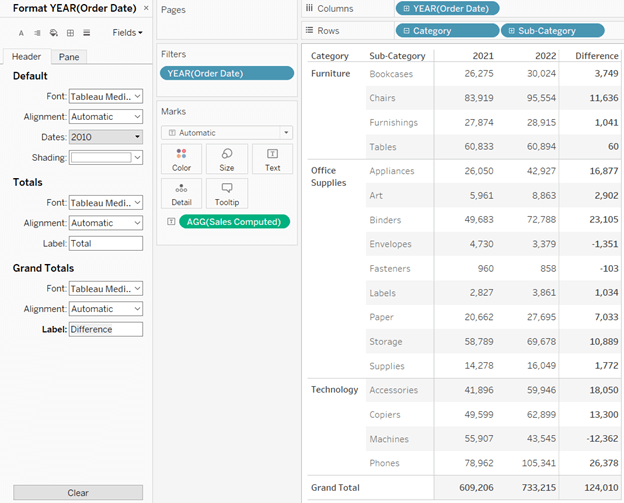
We would now have this.
We can update the label for the grand total, enable the grand totals for the columns too, and have our desired result.
To take this one step further, we can use level of detail (LOD) to make our calculation more flexible. We would however need to remember to add the filters to context.
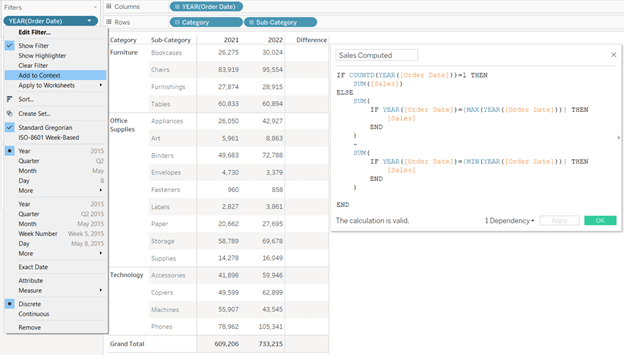
We now have a view which gets us the difference between any two years and also do not have a column with all null values.
