Guide to Unlocking Data’s Potential with Microsoft OneLake and Fabric Integration
Blog | October 7, 2024 | Chandan Kumar, Sudeep Srivastava
Enhancing Data Analytics with Microsoft OneLake and Fabric
Key Benefits of Microsoft Fabric and OneLake Integration
Best Practices for Maximizing Data with OneLake and Fabric
Data-driven decision-making demands a unified, highly integrated approach to data management. To this end, Microsoft OneLake and Fabric offer powerful solutions for data storage, seamless integration, and advanced analytics. By seamlessly integrating disparate data sources, including local files, into a centralized OneLake environment, organizations can unlock hidden value and drive innovation. In this blog we will guide you through the process of storing local files in OneLake, transferring them to a data warehouse using Microsoft Fabric, and leveraging that data in a semantic model. By doing this, you can transform raw data into actionable insights for better business outcomes.
What is Microsoft OneLake and Fabric Integration?
Key Advantages of OneLake for Data Management
How Fabric Improves Analytics Performance
Real-World Applications of OneLake and Fabric Integration
Introduction to Microsoft OneLake Features
Streamlining Data Workflows with Fabric
Maximizing Business Insights with Data Integration
Case Studies: Successful Data Integrations with Microsoft
Business Use Case
Before we explore the steps though, let’s first articulate the business use case for doing this. In a typical business environment data scattered across different locations can hinder effective analysis. With Microsoft OneLake File Explorer however, users can easily upload and manage on-premises flat files, like CSVs or Excel sheets, into a central repository. Using Microsoft Fabric, one can create automated pipelines to seamlessly transfer this data to a cloud-based data warehouse. Here, the data is structured into a semantic model, enabling simplified analysis and reporting. With this setup, businesses can gain real-time insights into various aspects of their operations like sales performance, inventory management, and customer feedback.
In this guide, we will learn how to:
Set up OneLake file explorer in local machine
Upload and manage your local files in OneLake.
Build a semantic model
Create and use a semantic model for data analysis.
Creating automated pipelines for storing data in the warehouse
We will create an automated pipeline to store local files in the data warehouse. This pipeline can be scheduled to trigger based on your specific requirements, ensuring timely and efficient data transfer and storage.
Setting Up OneLake File Explorer on Your Local Machine
To start, you need to install the OneLake File Explorer on your local machine. Once installed, OneLake will appear as a local drive on your computer, allowing you to access and manage all available objects seamlessly. Follow these steps to set it up:
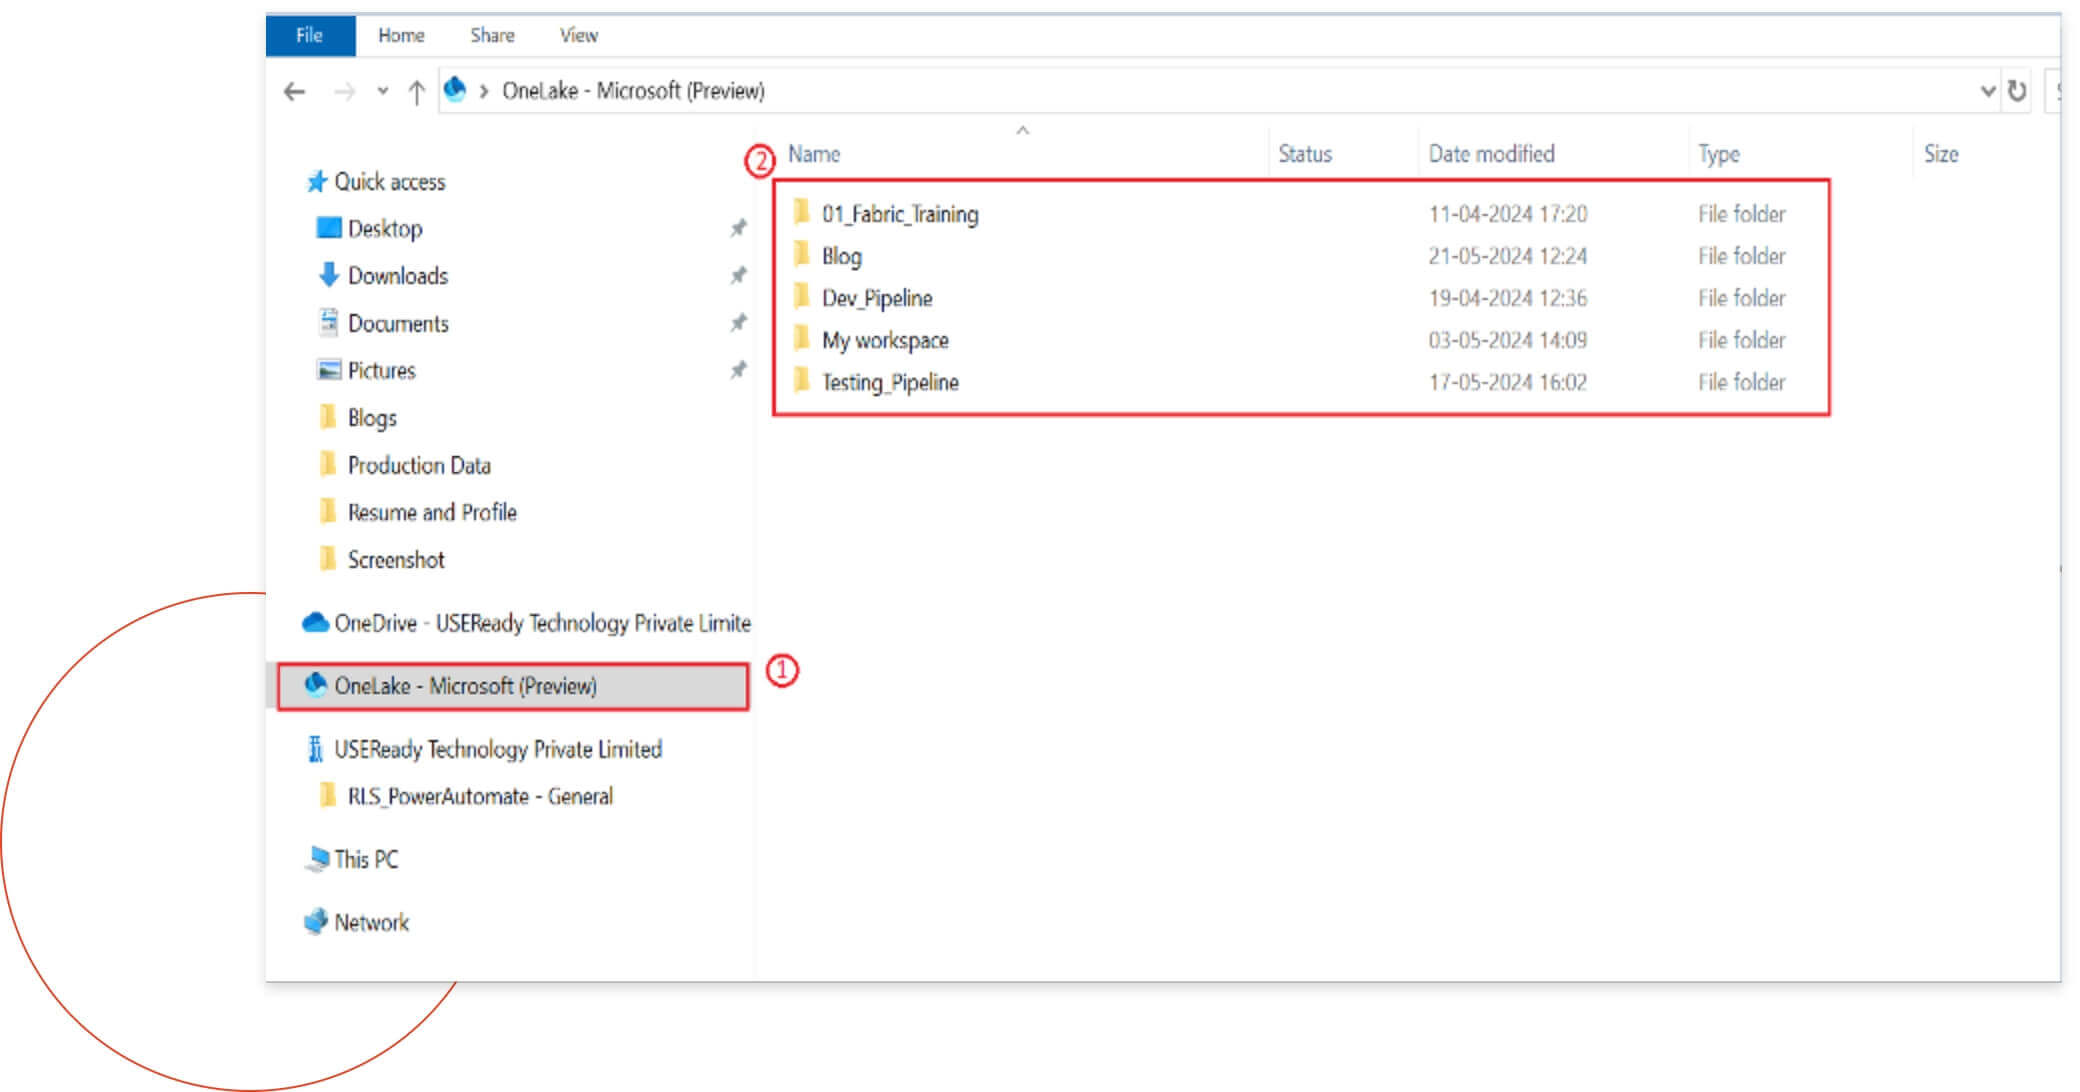
After installation, OneLake will be reflected as a local drive on your machine.
View Objects
You can now see and interact with all the available folders, as illustrated below:
Highlighted Area 1: OneLake file explorer ——— Highlighted Area 2: Workspaces
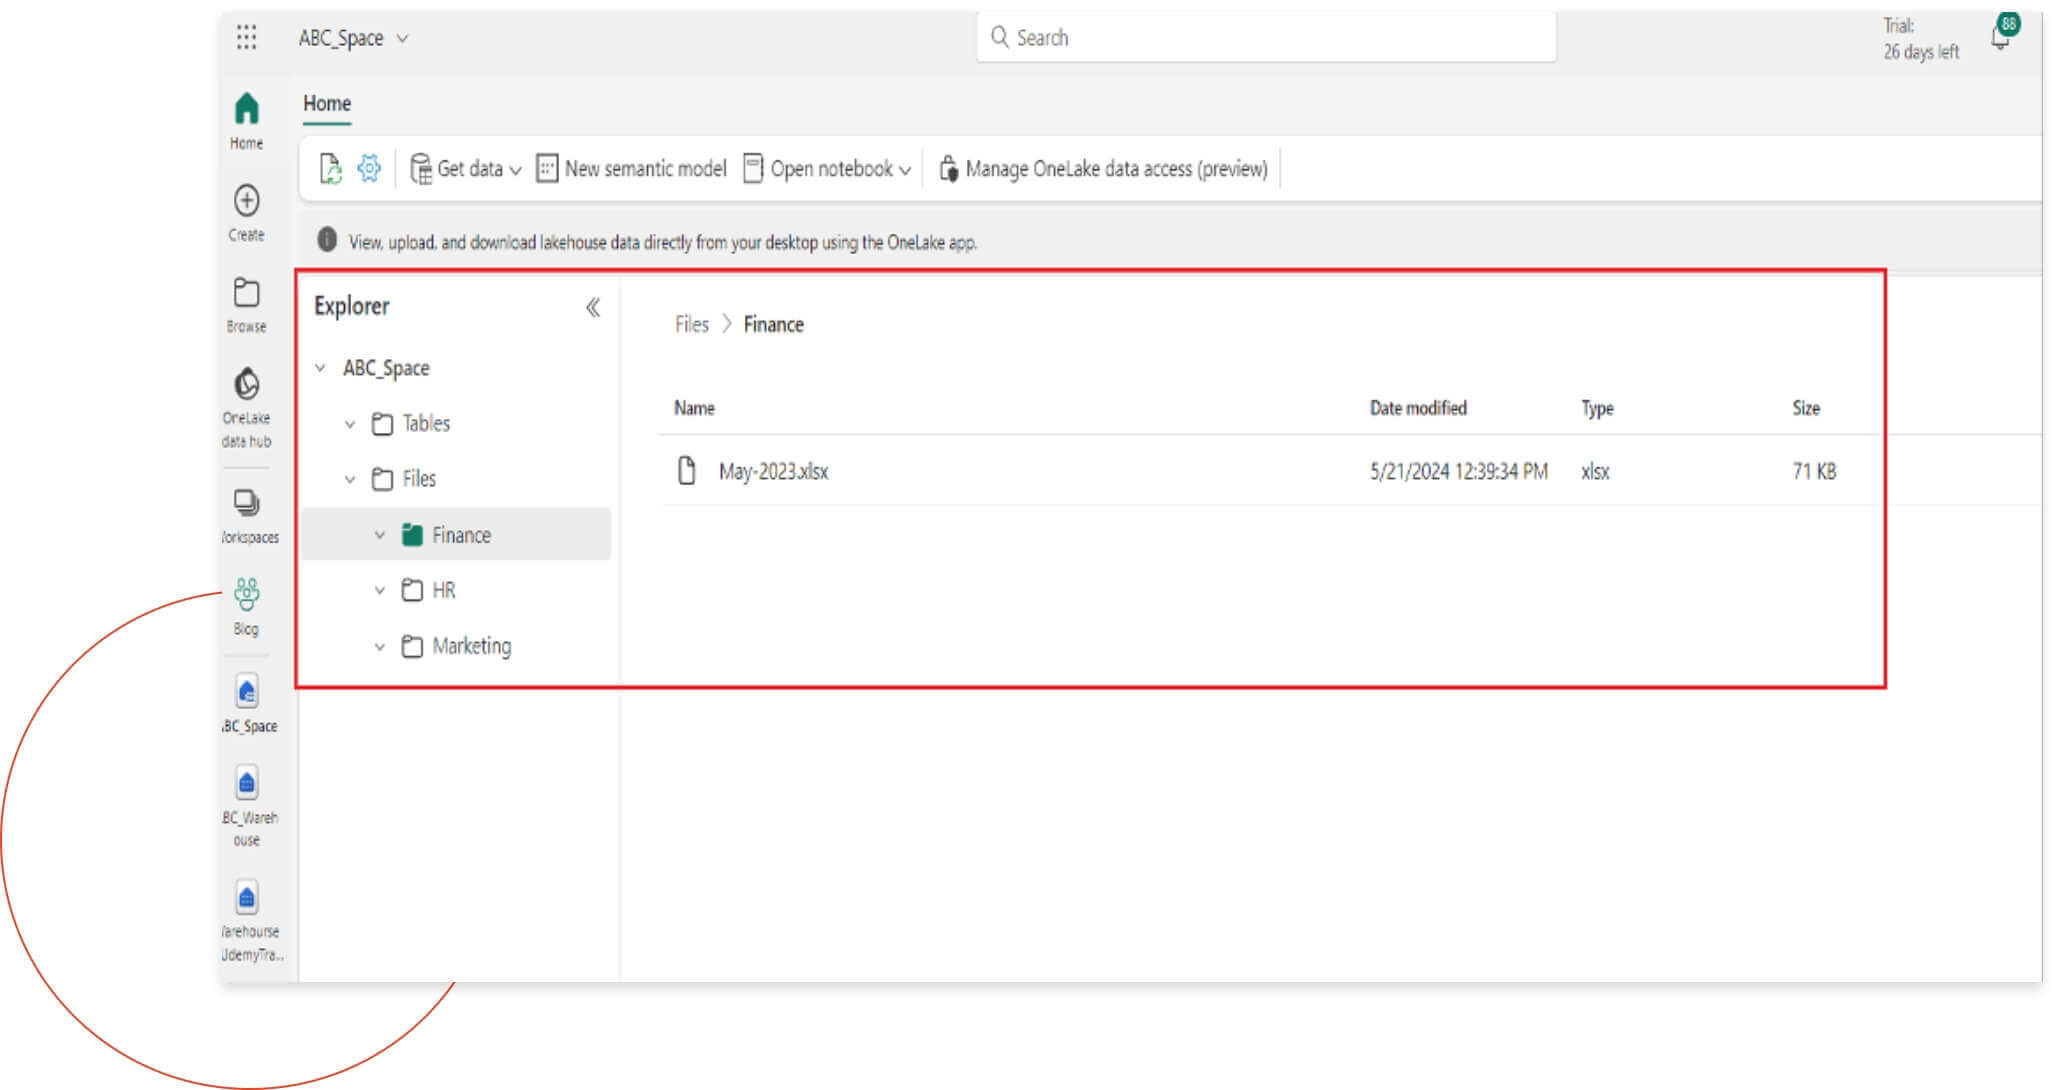
Here, you can see how data from various departments is consolidated in one place under OneLake. This unified structure makes it easy to access and manage data across different departments, all within a single lakehouse.
Highlighted Area : Workspace > Lakehouse > Files > Folders
This integration simplifies the process of managing your files directly from your local machine, providing a seamless experience for data storage and access.
Creating Automated Pipelines for Storing Data in the Warehouse
In the screenshot below, you can see a comparison of the folders viewed in the OneLake File Explorer on a local machine and the corresponding workspace in Microsoft Fabric. This seamless integration allows users to access and manage the same set of folders and files across both platforms, ensuring consistency and ease of navigation.
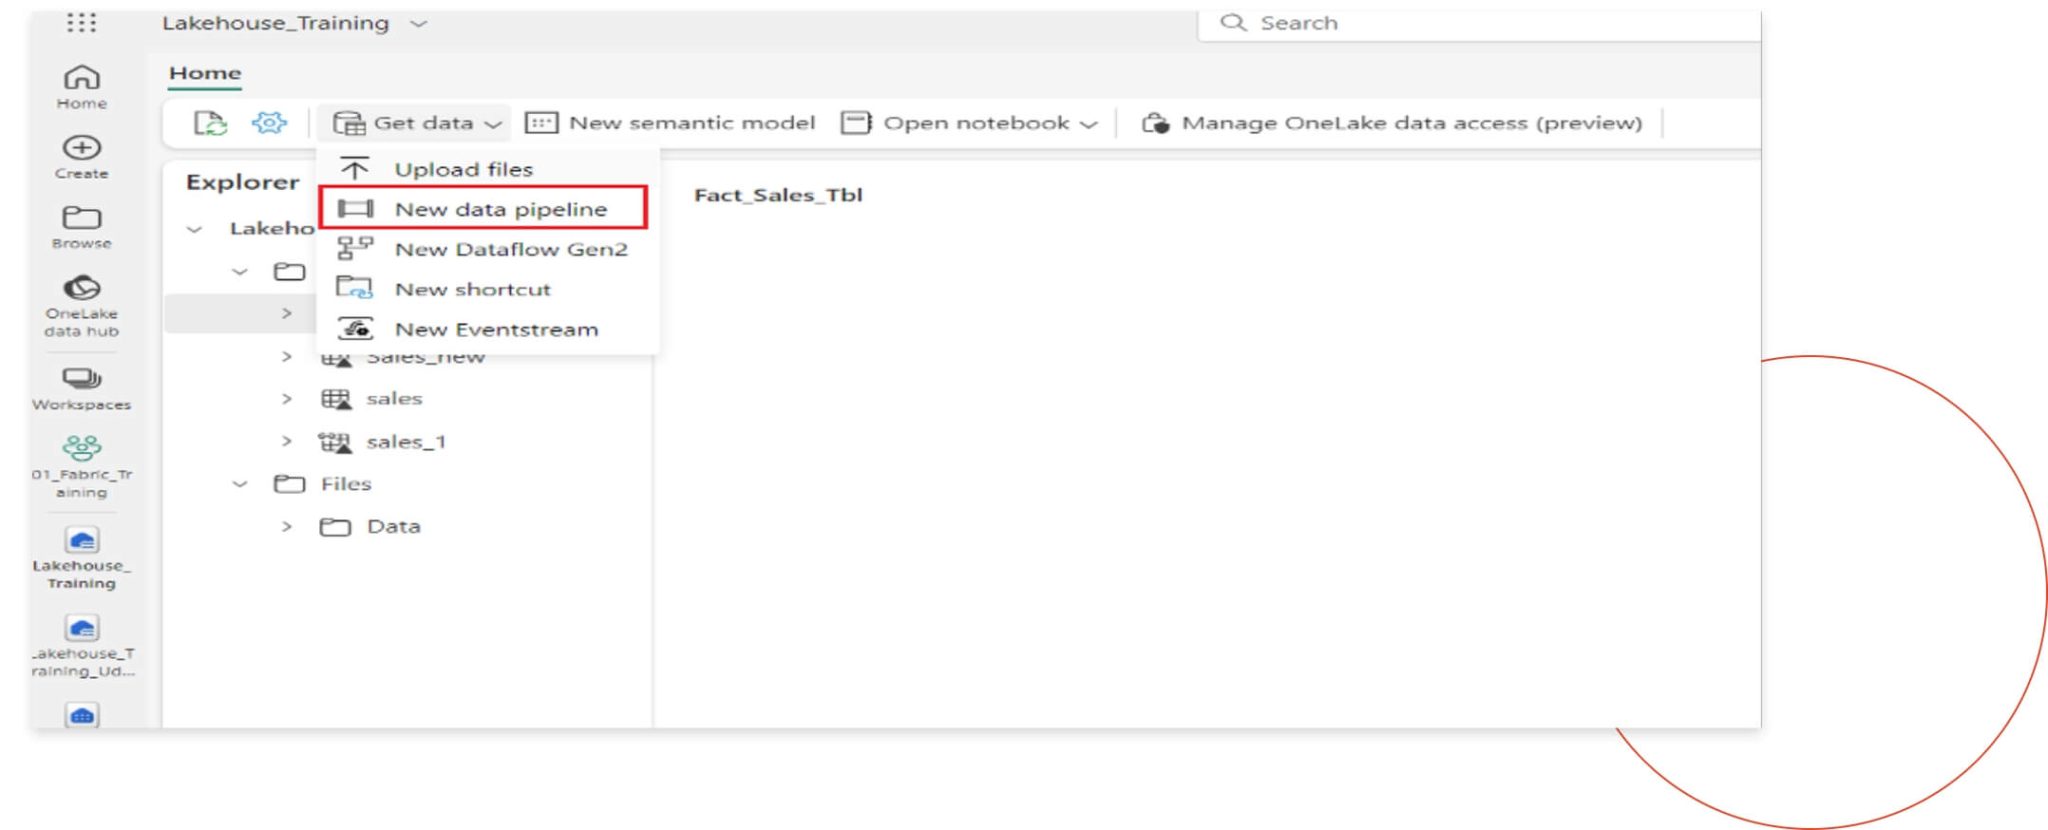
Now, to automate data loading into warehouse, we will create a new pipeline by following the steps shown in the image below:
Step 1
Under the specific warehouse, go to Get data and then create a new data pipeline.
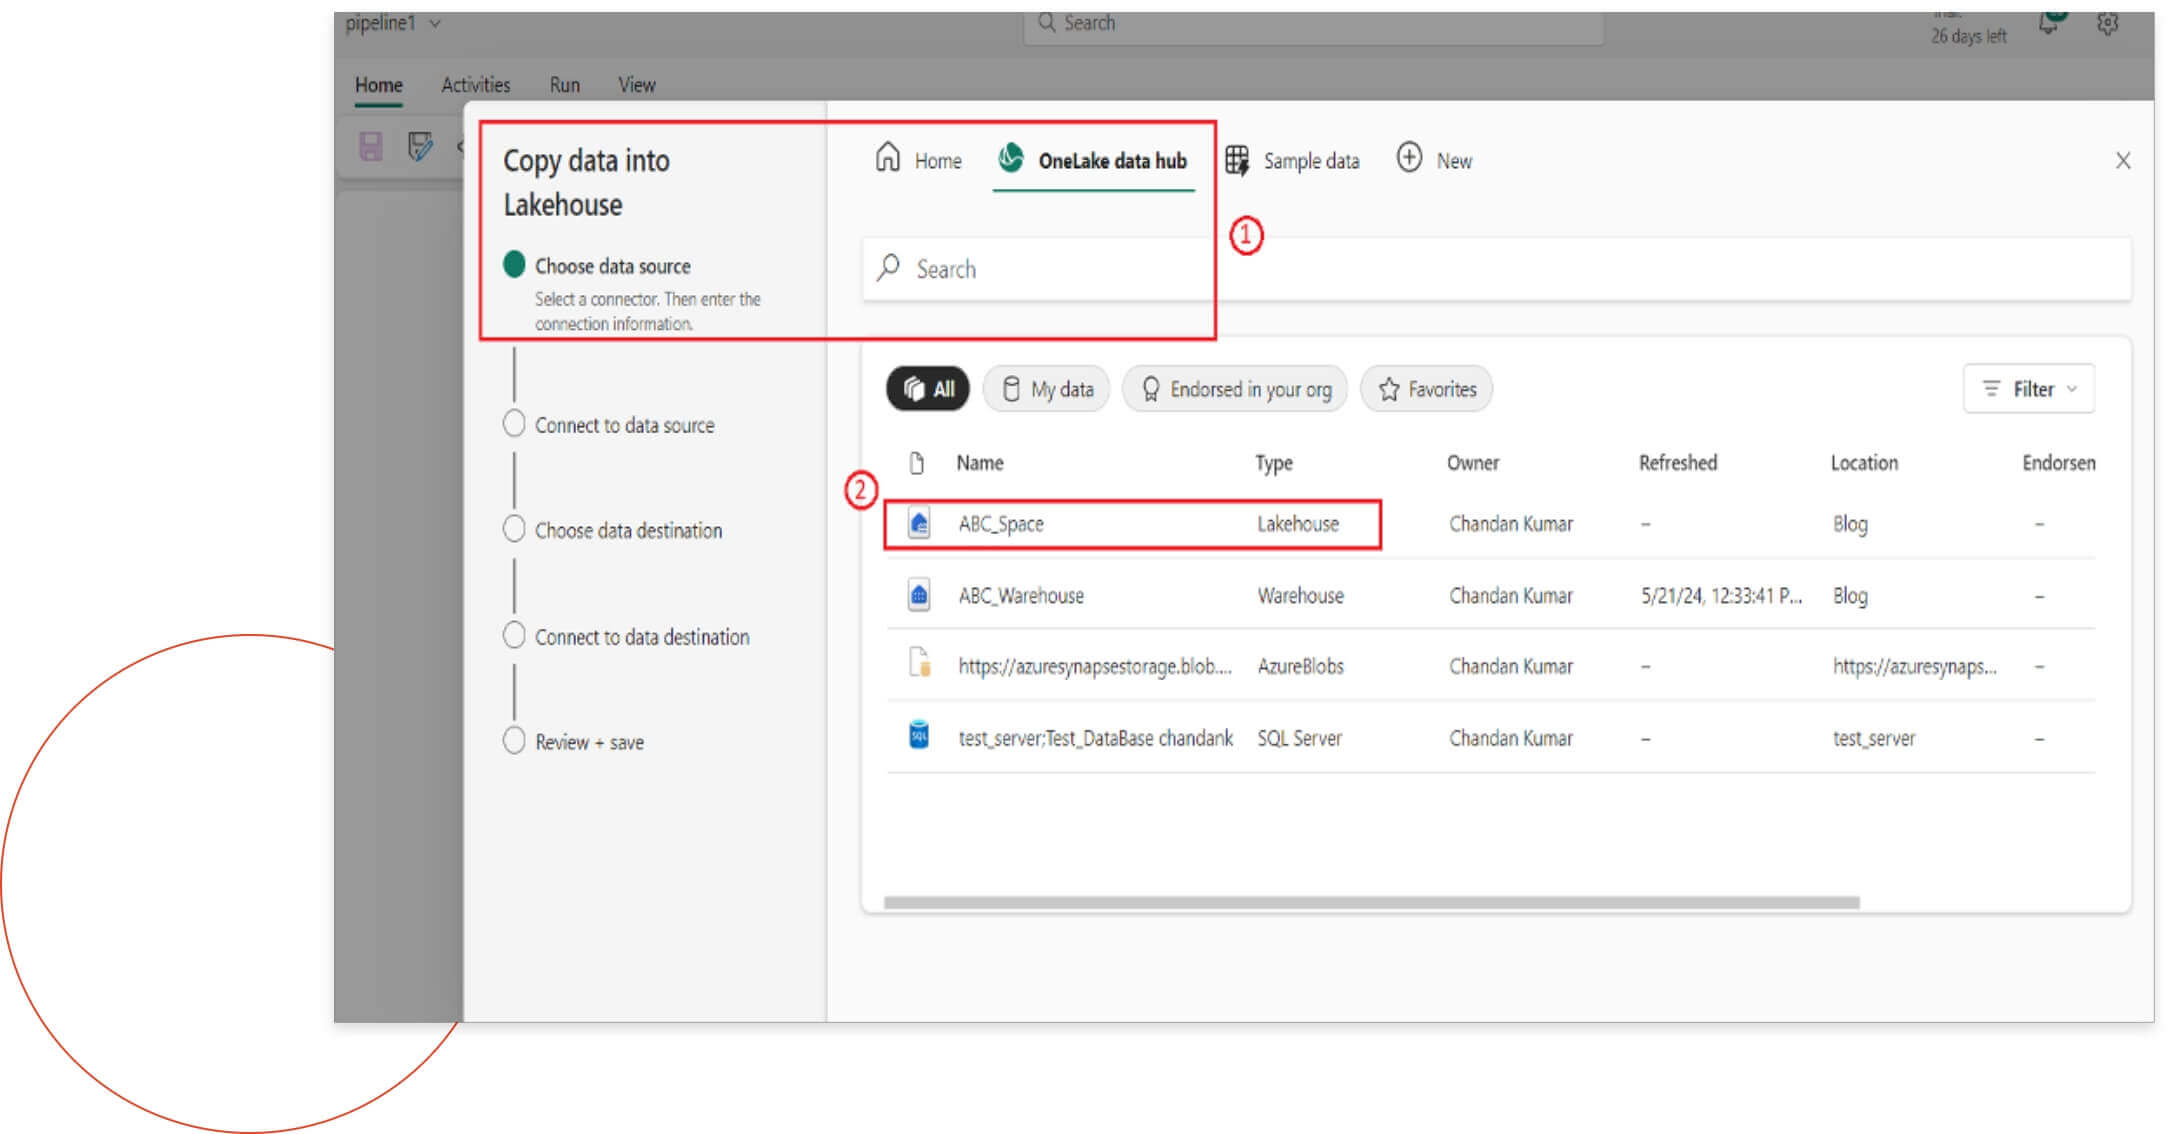
Step 2
After clicking on “New Data Pipeline,” a popup screen will appear. First, you will enter the name of the pipeline. After this, a new window will open where you will need to select the data source (OneLake Data Hub) and choose the specific lakehouse.
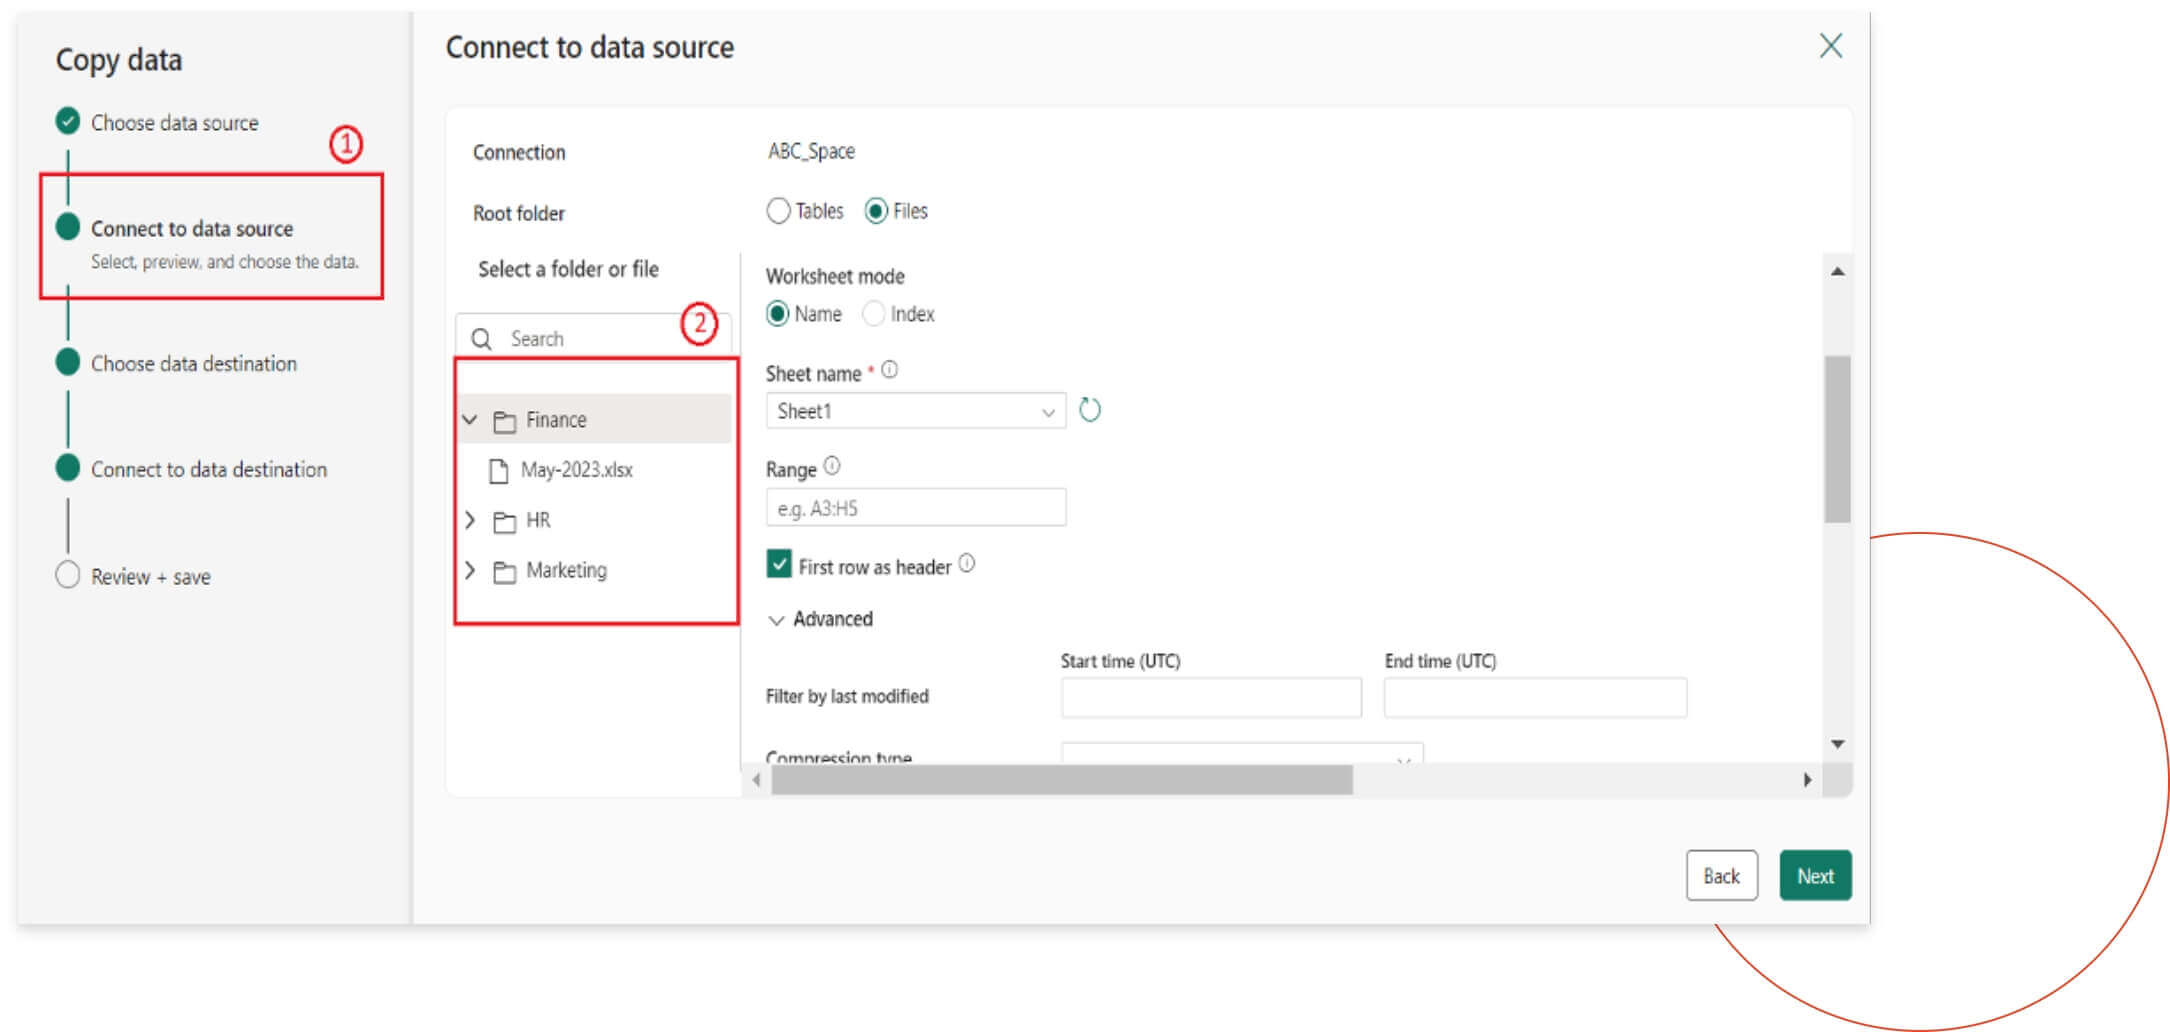
Step 3
Next, you will connect to the data source. Under the connection settings, select the specific folder where the data is located. Once the folder is selected, different options will appear as shown in the image. After making the necessary selections, click “Next” to proceed to the subsequent steps.
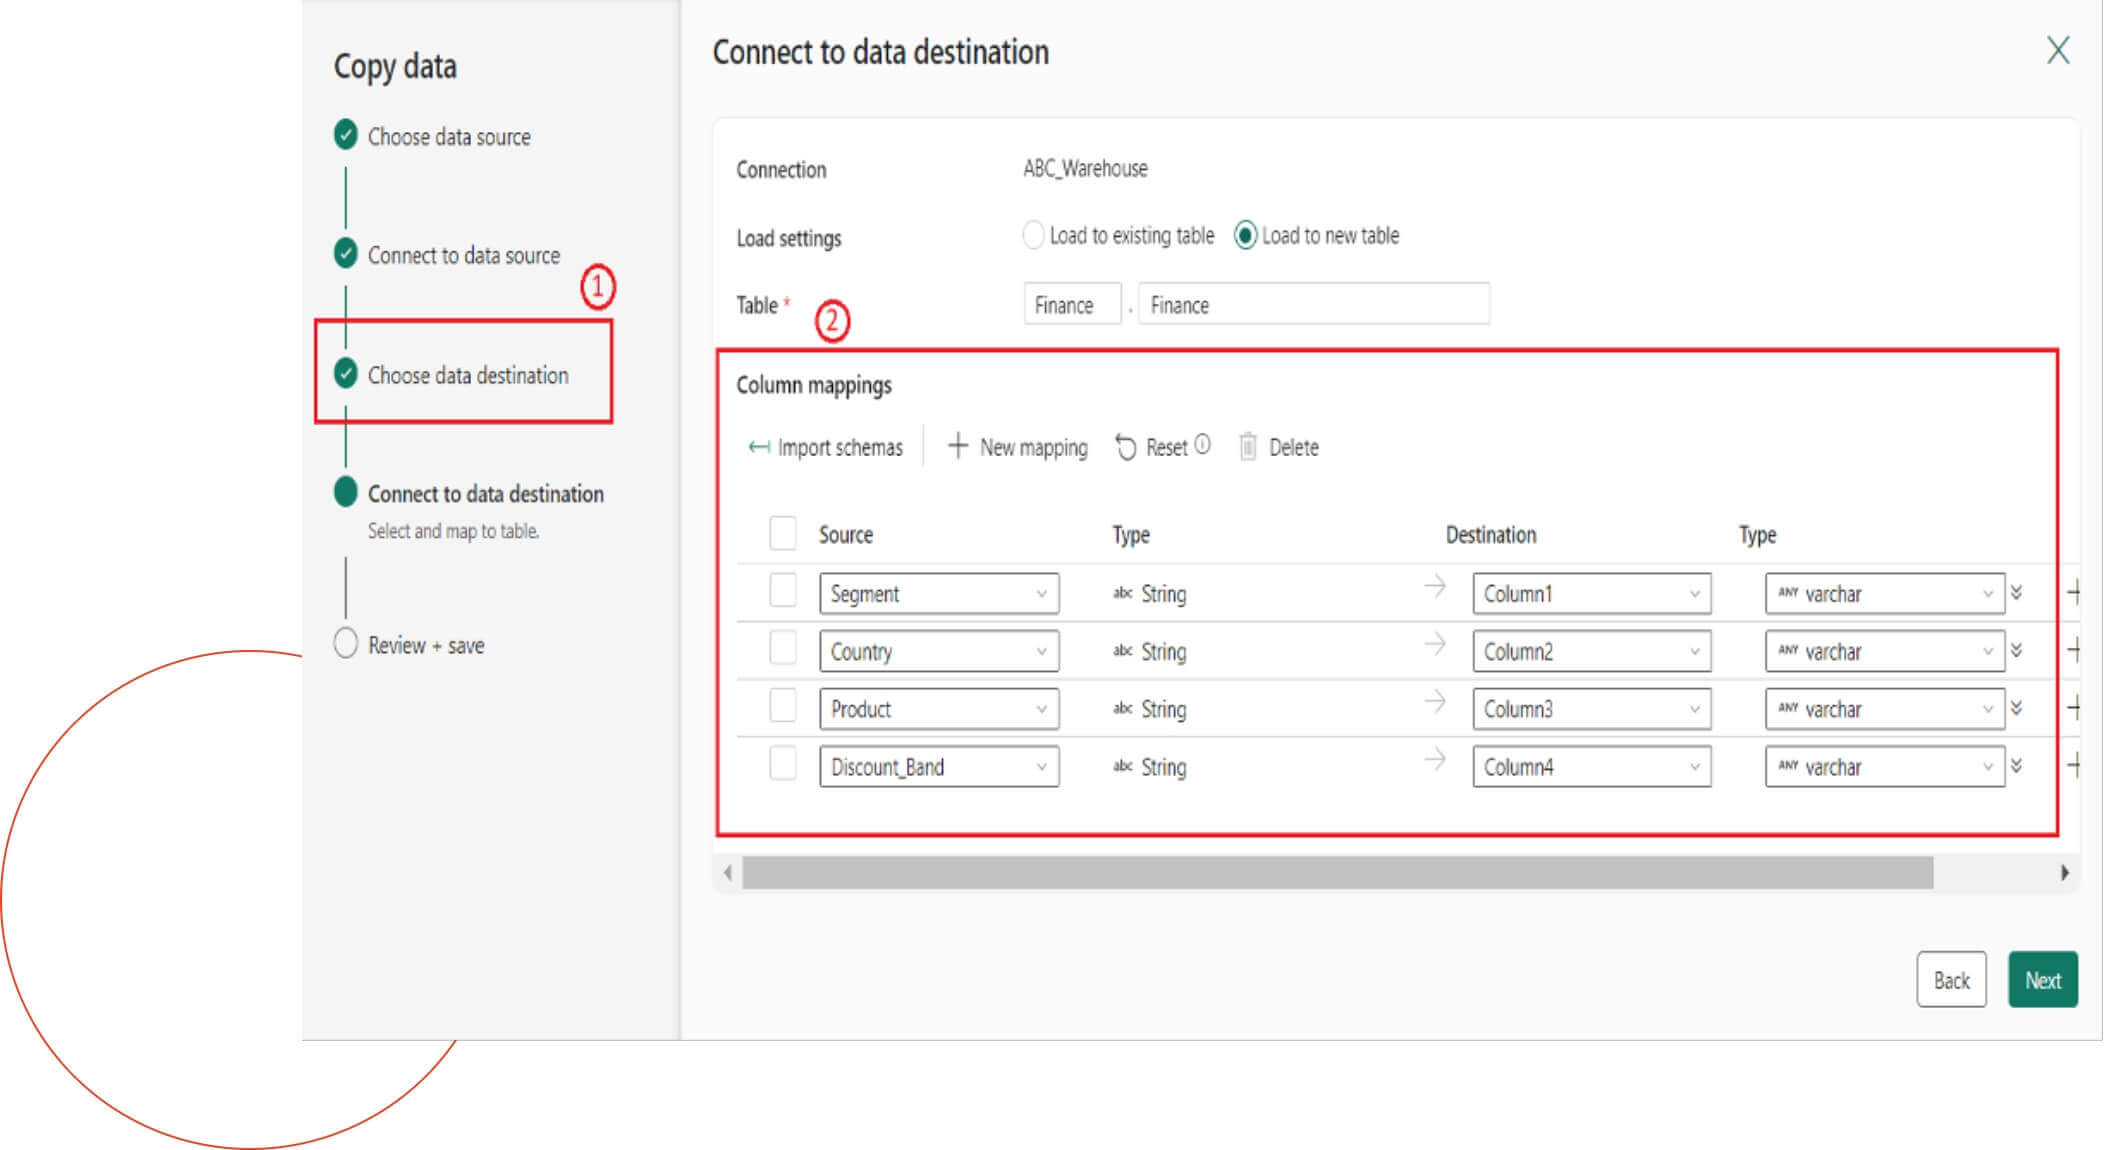
Step 4
Here, we will configure the data destination and define the column mappings. To do this, under the load settings, we specify that the data will be loaded into a new table. During the mapping process, we will ensure that the data type of each column is correctly matched.
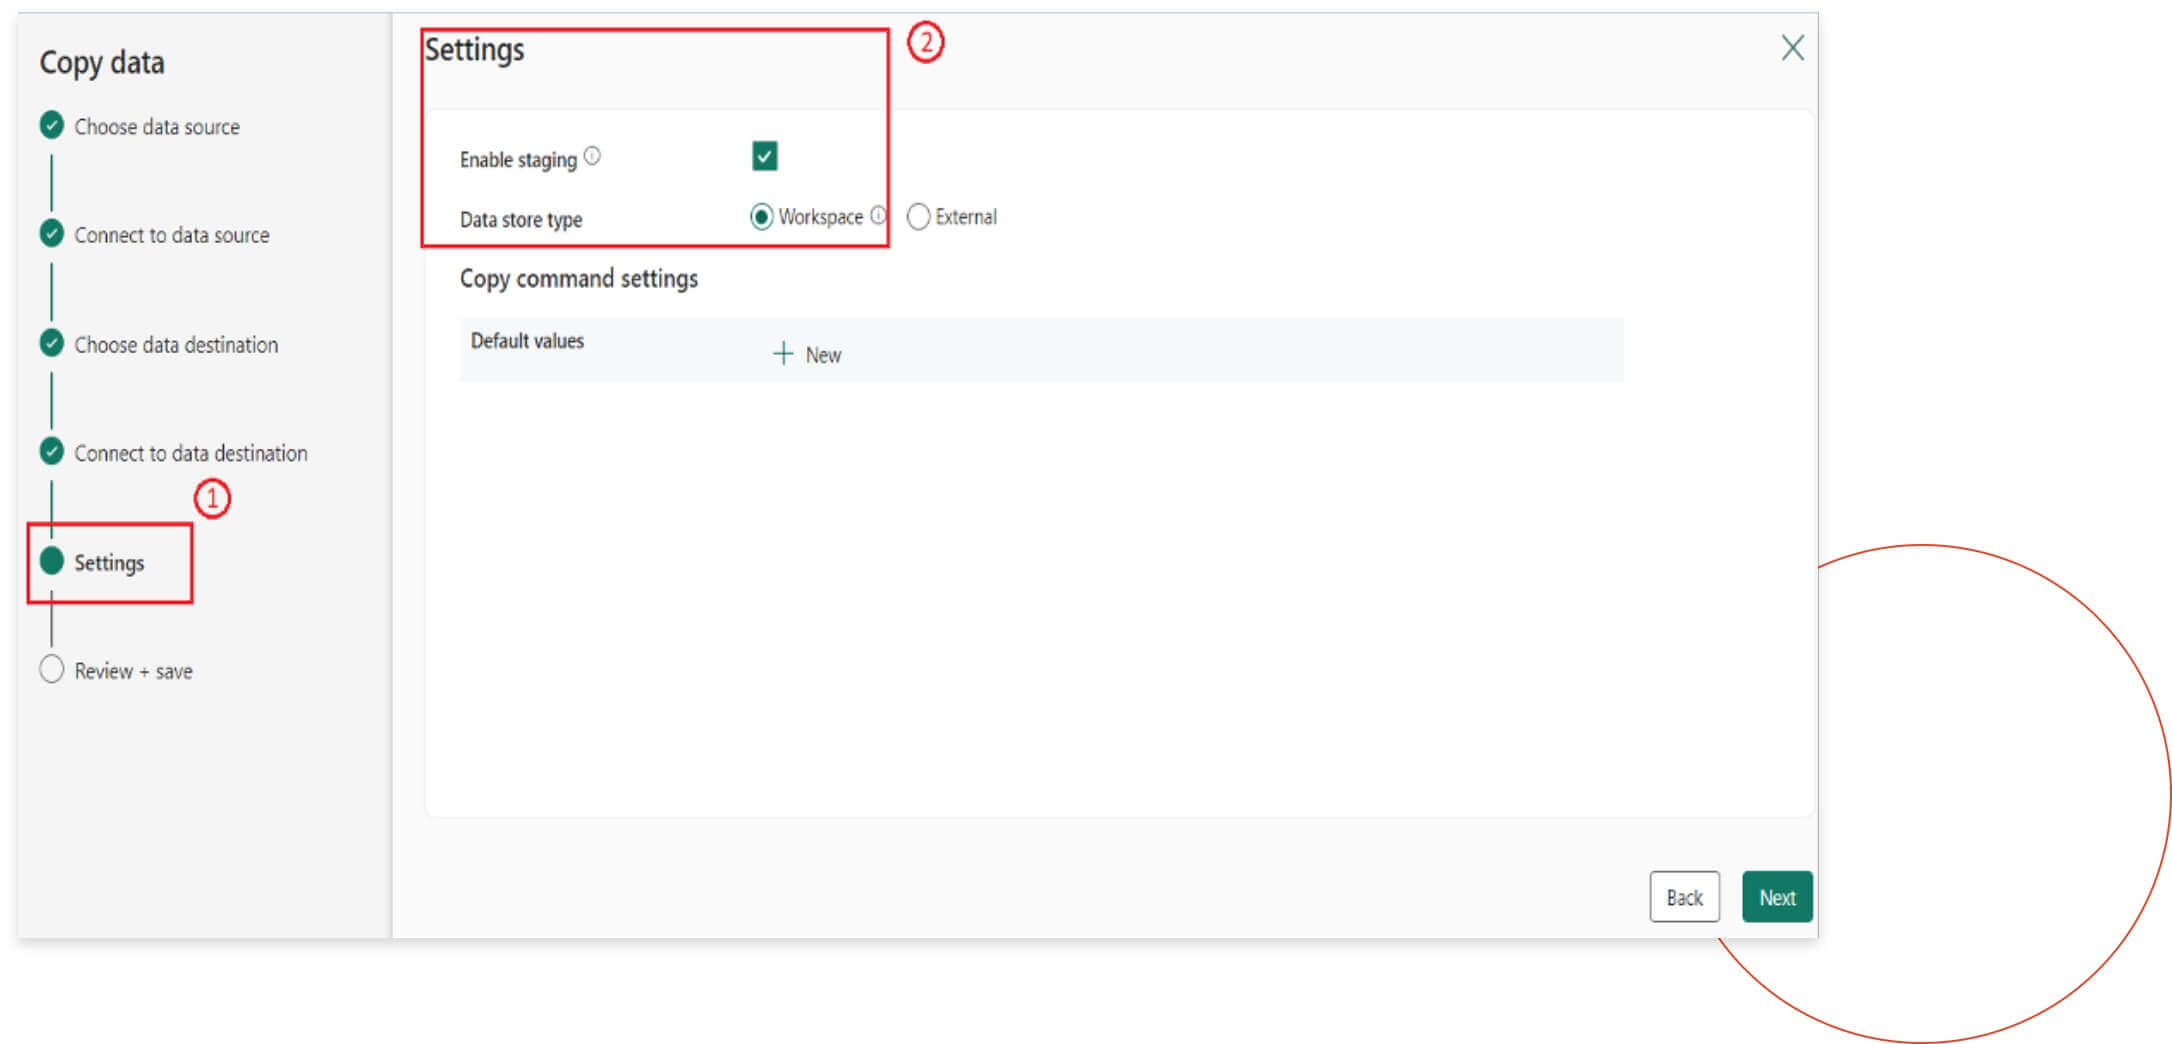
Step 5
In this step, we will enable the staging option. Then, under the data store type, we will select “Workspace” and click “Next” to proceed.
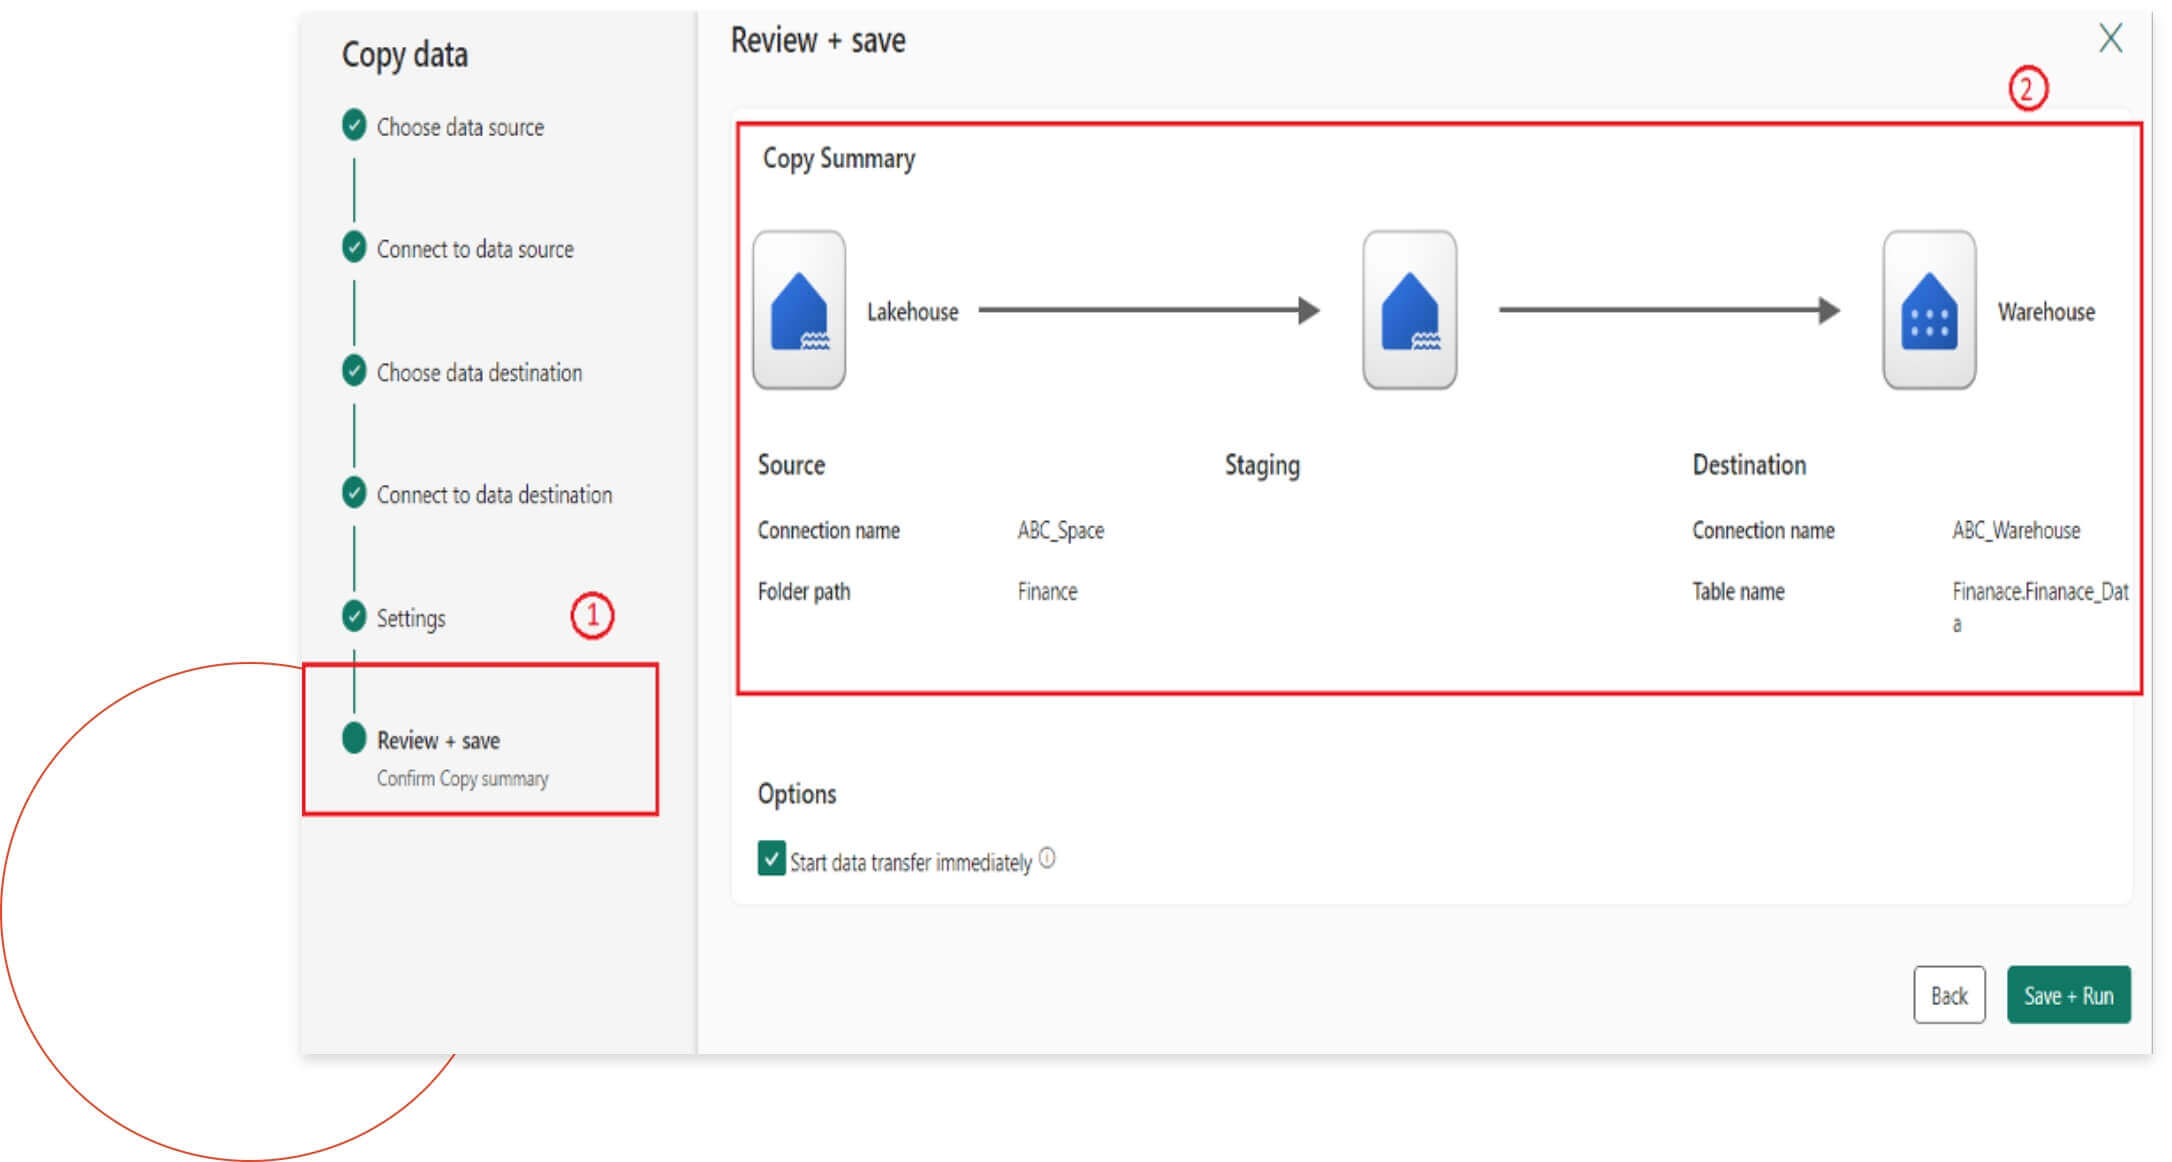
Step 6
After completing the above steps, we will see a final copy summary. This summary will show the flow of data from the source lakehouse, through the staging phase, and finally to the destination warehouse. After reviewing and monitoring everything, you’ll need to click “Save & Run” to execute the process.
Building a Semantic Model
Building a semantic model is crucial because it provides a structured and meaningful representation of data, enabling easier querying, analysis, and reporting. It helps transform raw data into business-friendly information, facilitating better decision-making. It’s a two-step process.
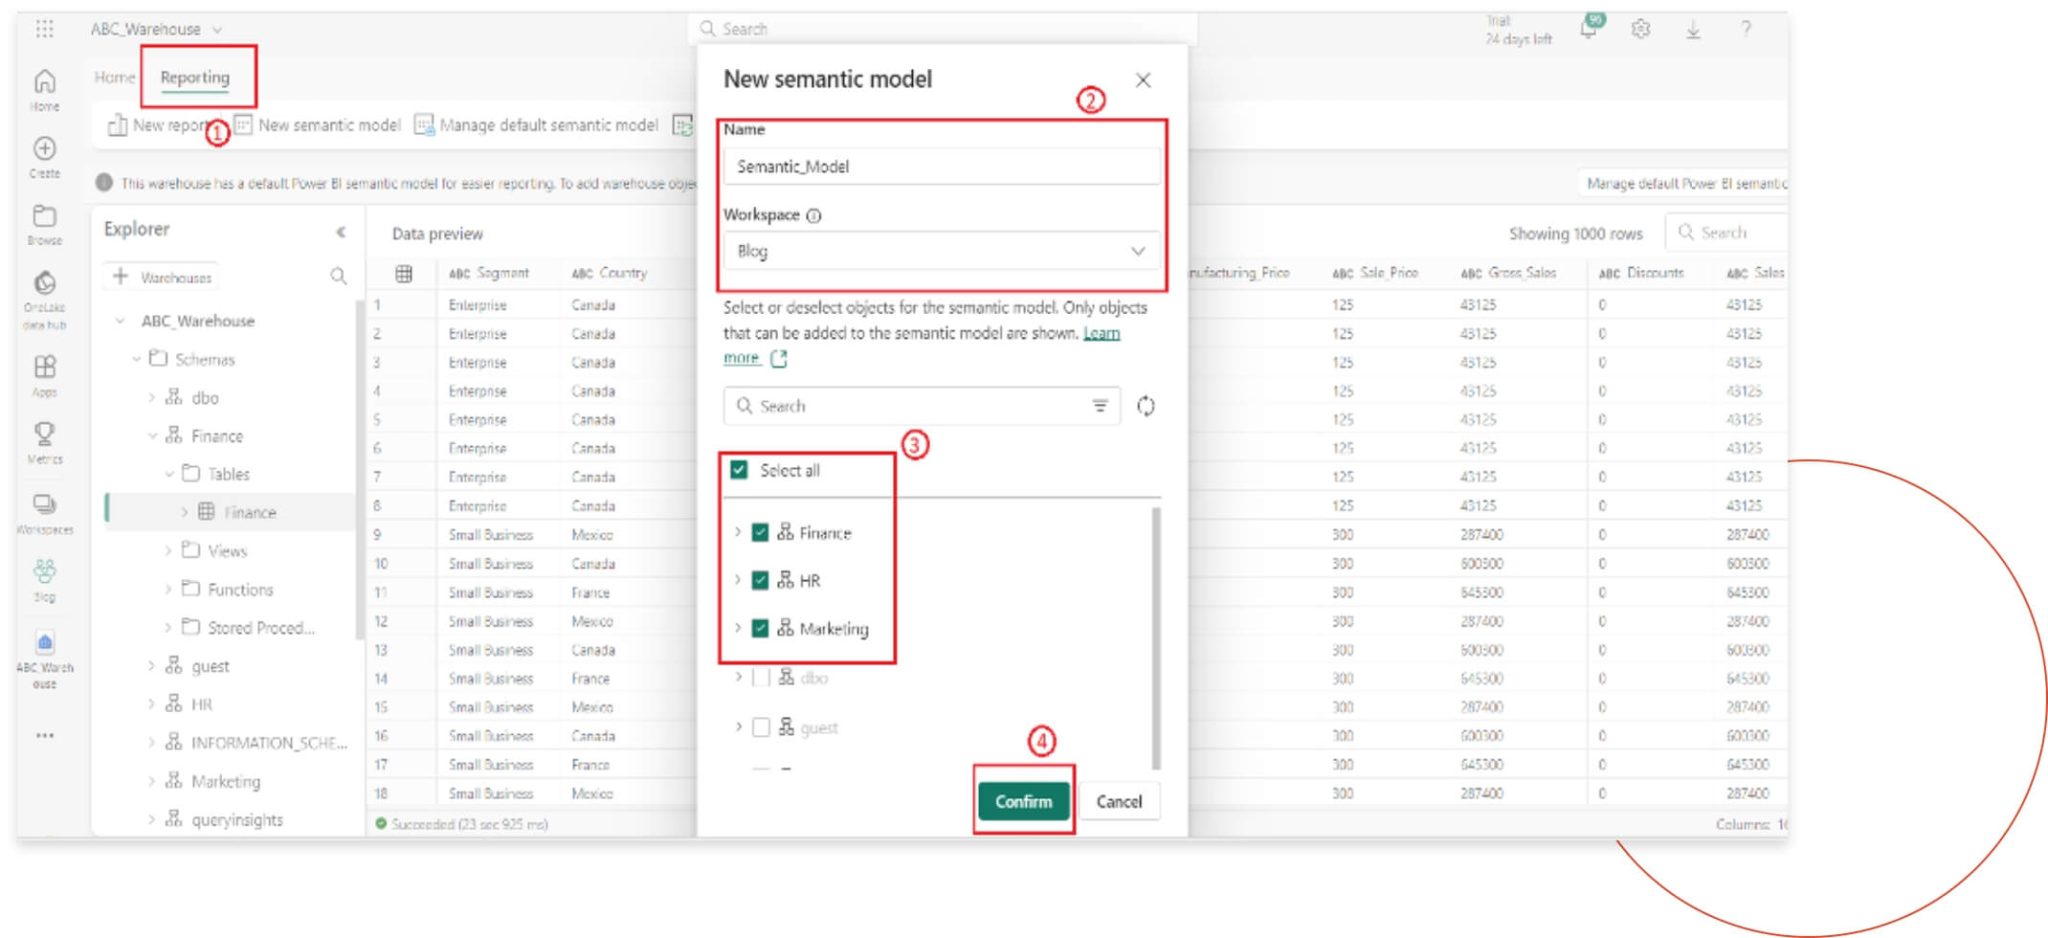
Step 1
Once the data is in the warehouse, we will create a new semantic model by following the screenshot markers. First, we will need to navigate to the reporting section and click on “New Semantic Model.” Nex, enter a name for the model and select the tables shown in the screenshot. Finally, click on the “Confirm” button to finalize the model. This process ensures that our data is organized and ready for efficient analysis and reporting.
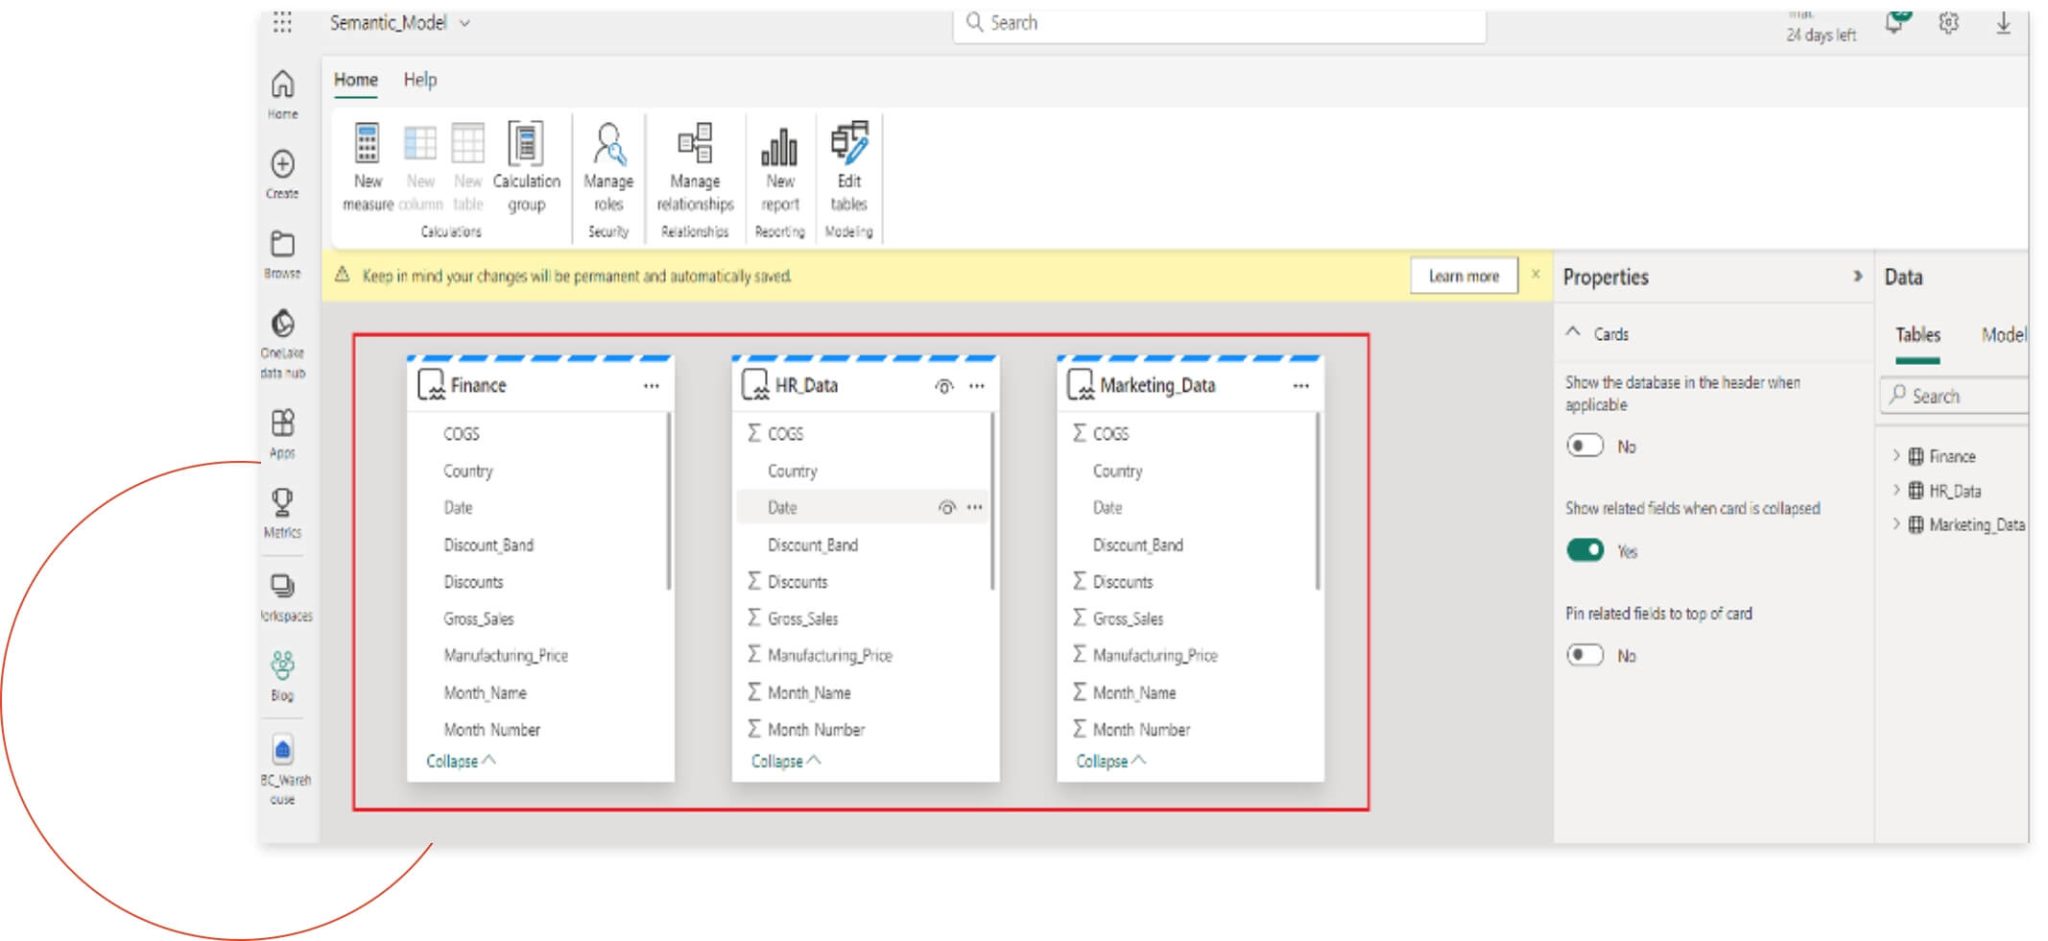
Step 2
Once you click confirm, the new semantic model is created. Any changes or additions to DAX calculations will be reflected in any subsequent report design within Power BI.
Conclusion
In conclusion, by combining effective management of on-premises flat files using OneLake File Explorer with the robust connectivity enabled by Fabric, organizations can ensure seamless file access, improved data organization, and enhanced collaboration across teams. This strategic combination unlocks the full potential of local data, transforming it into a valuable asset that drives informed decision-making and competitive advantage.
About the Author
BI Professional with over 9 years of experience, skilled in leveraging tools like Power BI and MS Fabric to transform complex data into actionable insights. Passionate about turning numbers into compelling narratives, with a focus on driving business decisions and fostering data-driven cultures.
Chandan KumarSr BI Analyst, Data Value | USEReady
About the Author
BI Professional with more than 4 years of experience, worked on tools like Power BI and Tableau, passionate about storytelling with data.
Sudeep SrivastavaBI Analyst, Data Value | USEReady
Submit your details
Services
Solutions/IPs
Industries
Resources
We use cookies and similar technologies to enable services and functionality on our site and to understand your interaction with our service. By clicking on accept, you agree to our use of such technologies for marketing and analytics. See Privacy Policy
When you visit any web site, it may store or retrieve information on your browser, mostly in the form of cookies. This information might be about you, your preferences or your device and is mostly used to make the site work as you expect it to. The information does not usually directly identify you, but it can give you a more personalised web experience. Because we respect your right to privacy, you can choose not to allow some types of cookies. Click on the different category headings to find out more and change our default settings. However, blocking some types of cookies may impact your experience of the site and the services we are able to offer.
These cookies are necessary for the website to function and cannot be switched off in our systems. They are usually only set in response to actions made by you which amount to a request for services, such as setting your privacy preferences, logging in or filling in forms. You can set your browser to block or alert you about these cookies, but some parts of the site will not then work. These cookies do not store any personally identifiable information.
These cookies enable the website to provide enhanced functionality and personalisation. They may be set by us or by third party providers whose services we have added to our pages. If you do not allow these cookies then some or all of these services may not function properly.


 Media Coverage
 Press Release