Calculating Business Age in Power BI: Essential Methods
Unveiling Techniques for Determining Business Age in Power BI
Harnessing Power BI for Accurate Business Age Calculations
Power BI has a lot of features that are very easy for Excel users to leverage. One very common reporting requirement is the Calculation of Business Age. Most reporting tools are designed to perform automatic Arithmetic calculations. So, it is easy to find the Calendar Age i.e. number of days elapsed which includes the weekends. But the challenge is the elimination of weekends.
As mentioned in one of the other blogs, Business Age is one of the very common needs for Business reporting ranging from trade transactions, retail analysis, inventory backfill, application processing etc.
This will be a very basic blog that aims at using Power BI features to find the number of Business Days between two dates. In simple words, we want to find the number of weekdays. Here we are not considering holidays. We will be discussing two approaches. For most part of the blog, we will be relying on the Power Query (Query editor) part of Power BI and very less part of the Power View (use of Dax)
There are many blogs and community posts that deal with this type of calculation. Most methods focus on subtracting the weekends from the Calendar days. All of those are successfully used. In this blog, we will try something different. We will try to simulate a SQL type approach where a Date table is used for mapping the Dates and fetch the required values for the Age calculation.
Understanding the Importance of Business Age in Power BI
Exploring Different Approaches to Calculate Business Age in Power BI
Implementing Advanced Date Calculations for Business Age Analysis in Power BI
Enhancing Insights with Business Age Visualizations in Power BI
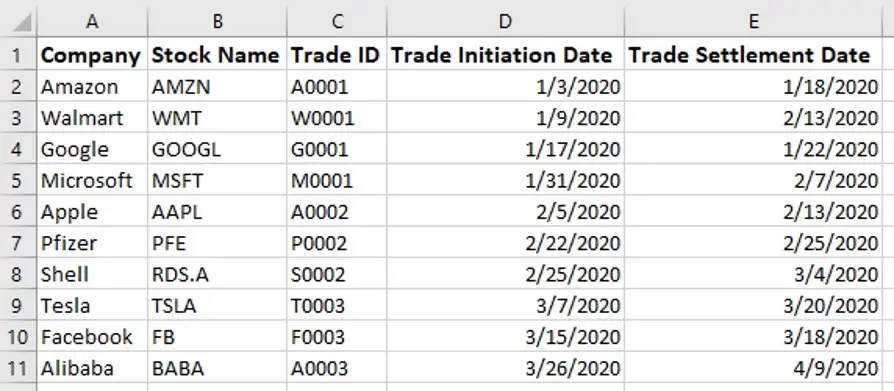
Let us treat it as a use case. We have a very simple dataset that has some trade information. Our steps will lead us in finding the number of business days between Trade Initiation Date and Trade Settlement Date.
Method 1
As mentioned before this method will use the Query Editor Features. Here the whole idea is creating a mapping Date Table. This Date table will have flags for weekdays and cumulative sum of numbers for each day. Then it is joined back to the main table twice – once for the Trade Initiation Date and once for the Settlement Date. The resulting weekday numbers are subtracted for the business days.
Leveraging DAX Functions for Business Age Calculation in Power BI
Utilizing Power Query for Dynamic Business Age Calculations in Power BI
Best Practices for Handling Date-based Metrics in Power BI for Business Age Analysis
Optimizing Performance and Accuracy in Business Age Calculations with Power BI
1) The first step would be to connect to the trade transactions data file in Power BI.

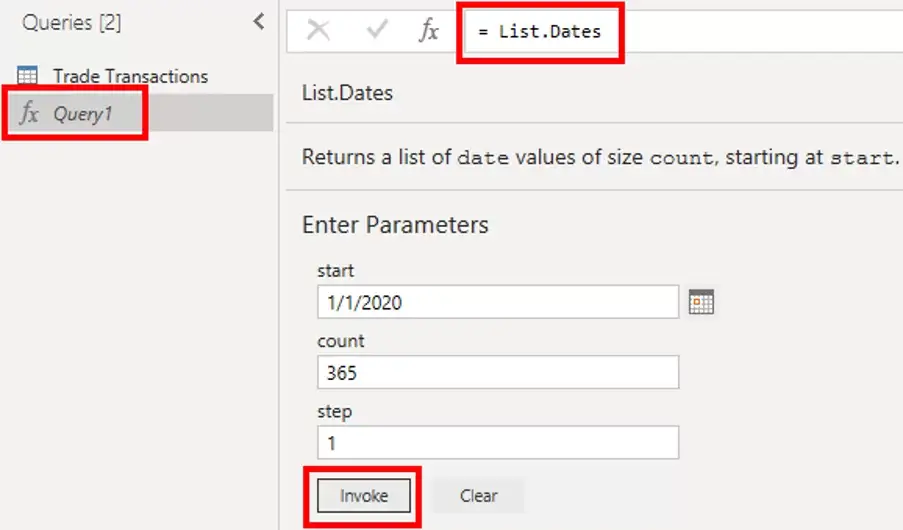
2) Next, we need to create Date Table. We can use the List.Dates function to provide a list of values. It is always good practice in Power BI to create a date table that has all dates without breaks. Since the date table does not occupy a lot of space in the data model, it is good to define a table that ranges about 15 years, some years in the past and some in the future with respect to the dataset in use. For this example, we will create only for the year 2020.
The trick here is to start with a blank query and then transform it to a table.
The List.Dates function automatically provides the parameters to create a table list.

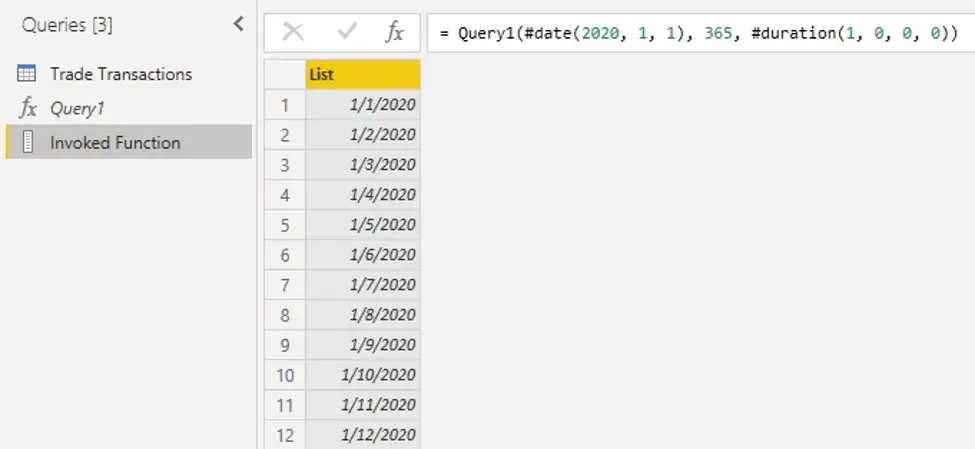
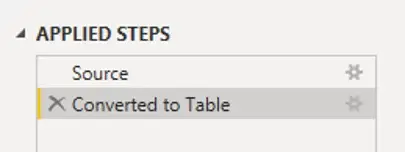
3) This is a very important step. At this point it is just a list. This needs to be converted into a Table.
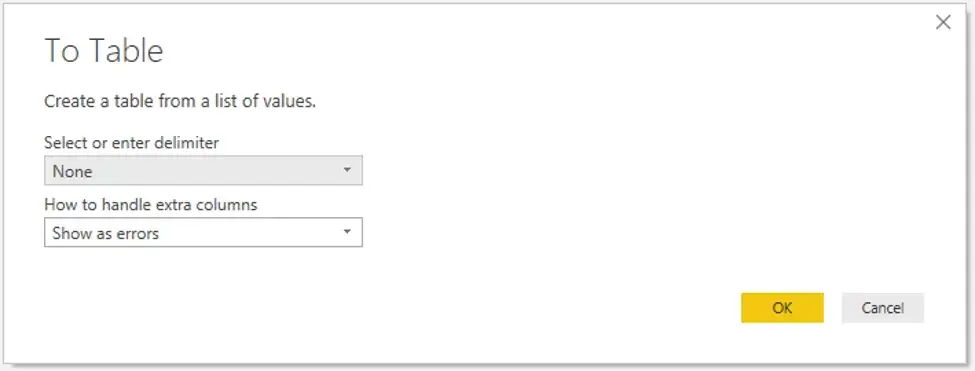
We need to use the To Table function under the Transform tab of the toolbar.

We do not have to specify the delimiter because the entire value in the column has to be invoked as is.

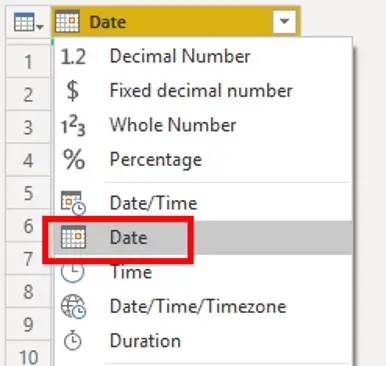
We can convert to a Date format and rename the field if needed. This step can be done later too during the joining step.
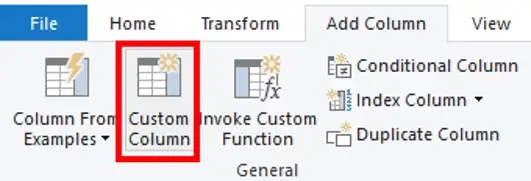
4) Next, we need to find the weekdays and weekends for the entire data. We will create a custom column using the Date.DayOfWeek() function
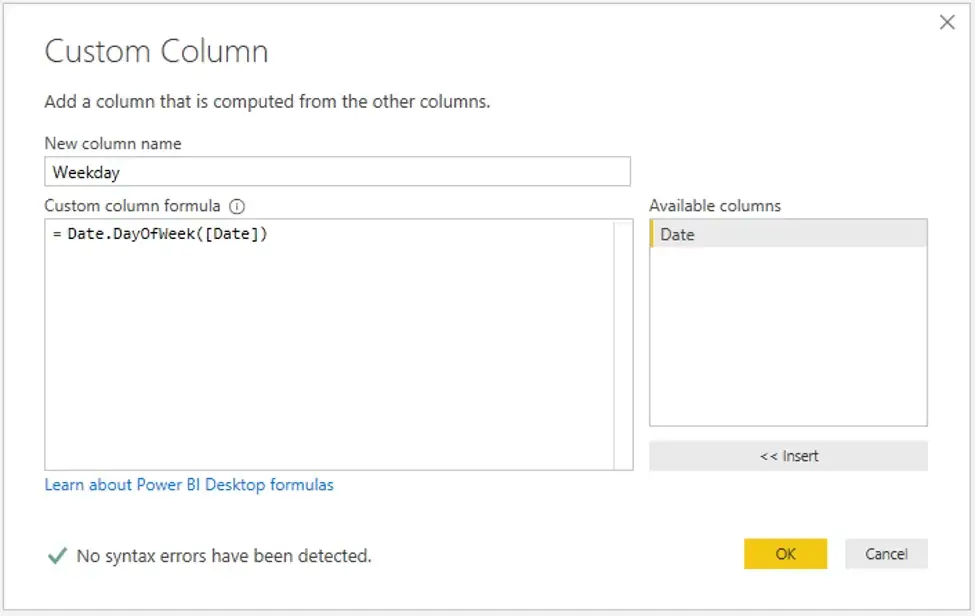
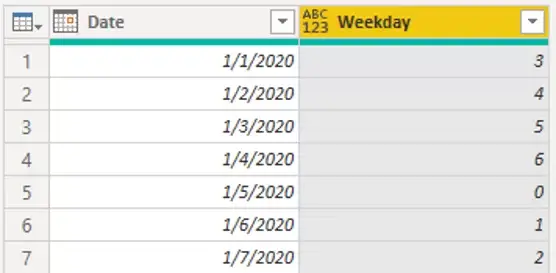
After the calculation executes, we can see the day numbers. Sunday is 0 and Saturday is 6.
5) We need a number for the weekdays and we need to eliminate weekends. So, we will assign 0 to Saturday and Sunday and 1 for the weekdays Monday to Friday. We will use the conditional column.
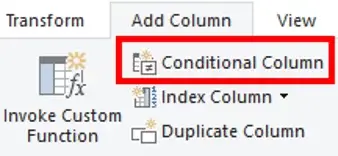
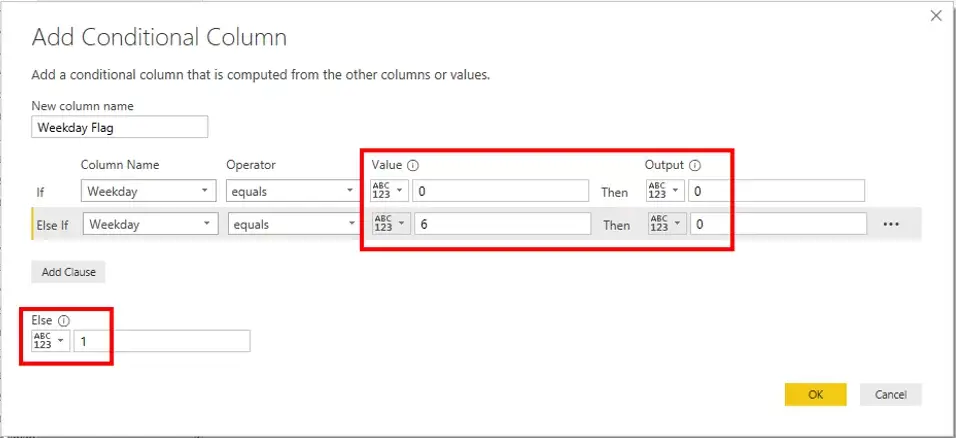
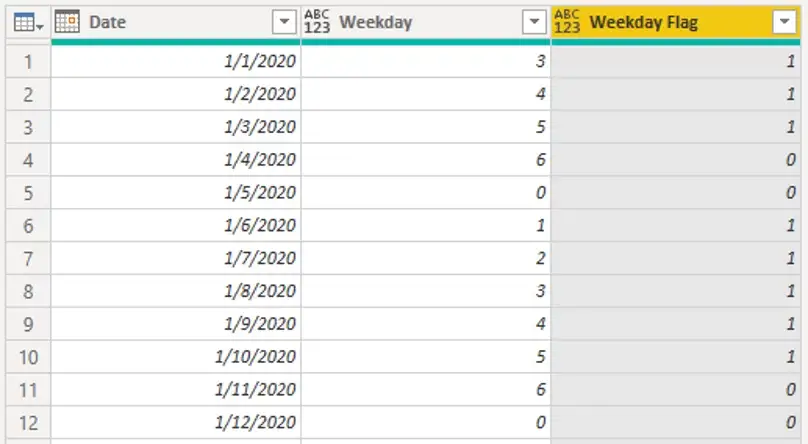
Internally it is a very simple nested IF-ELSE function.
Now, we need a cumulative sum of the Weekday flag column. For the cumulative sum function to work, we need to add the Index column.
6) Adding the Index column starting from 1. The index function will just a add a unique ID to each row.
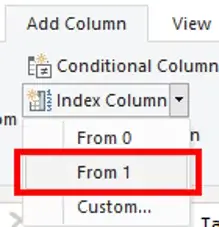

7) Now, we need to use the List.Sum function to find the cumulative sum or the running total.
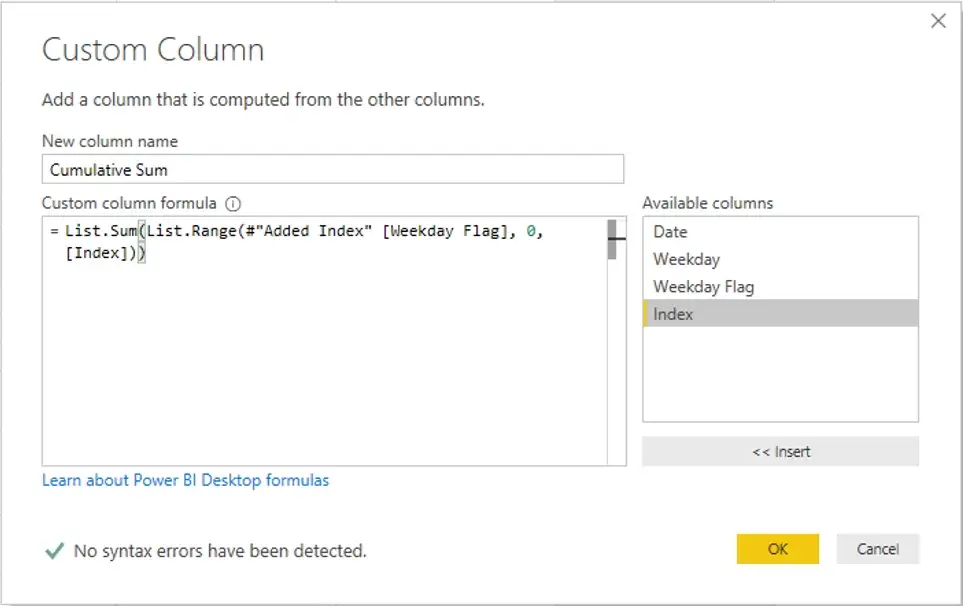
We need to carefully analyze the calculation.
Starting from the inner part of the function.
List.Range as the name suggests reads the entire range. It has the Added Index along with the Weekday Flag field. This is mandatory for any step in Power Query because every step calls the previous step and then executes the new step. The 0 says that the calculation to start from the first value in the Weekday Flag column. The Index tells the function to read all values until the Index column ends.
The List.Sum goes to every row and adds the values in the List.Range. Since weekends are 0, the cumulative sum will duplicate in those rows.
In simple terms, it is trying to replicate a for loop or a do-while loop.
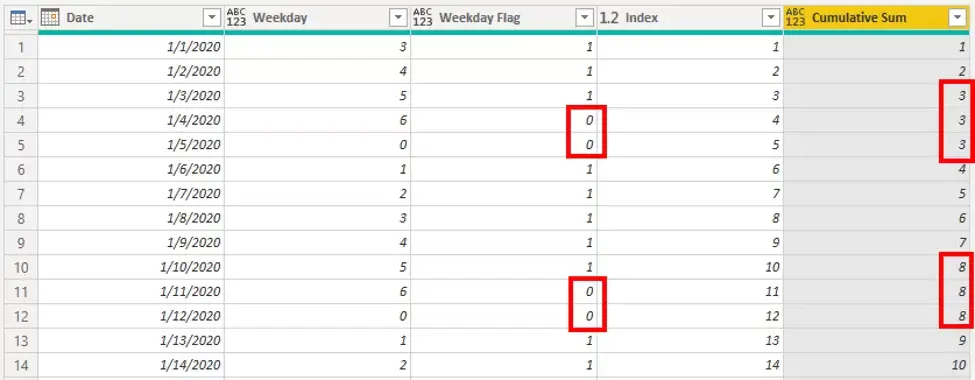
Now, for the final few steps.

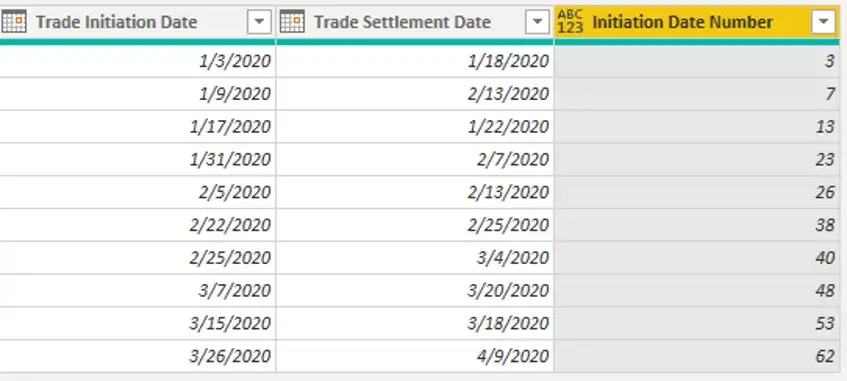
8) We will merge the Transactions table and the Date table as a Left Join on the Initiation Date and the Date field. (Inner Join also would work). This will be the First Join.
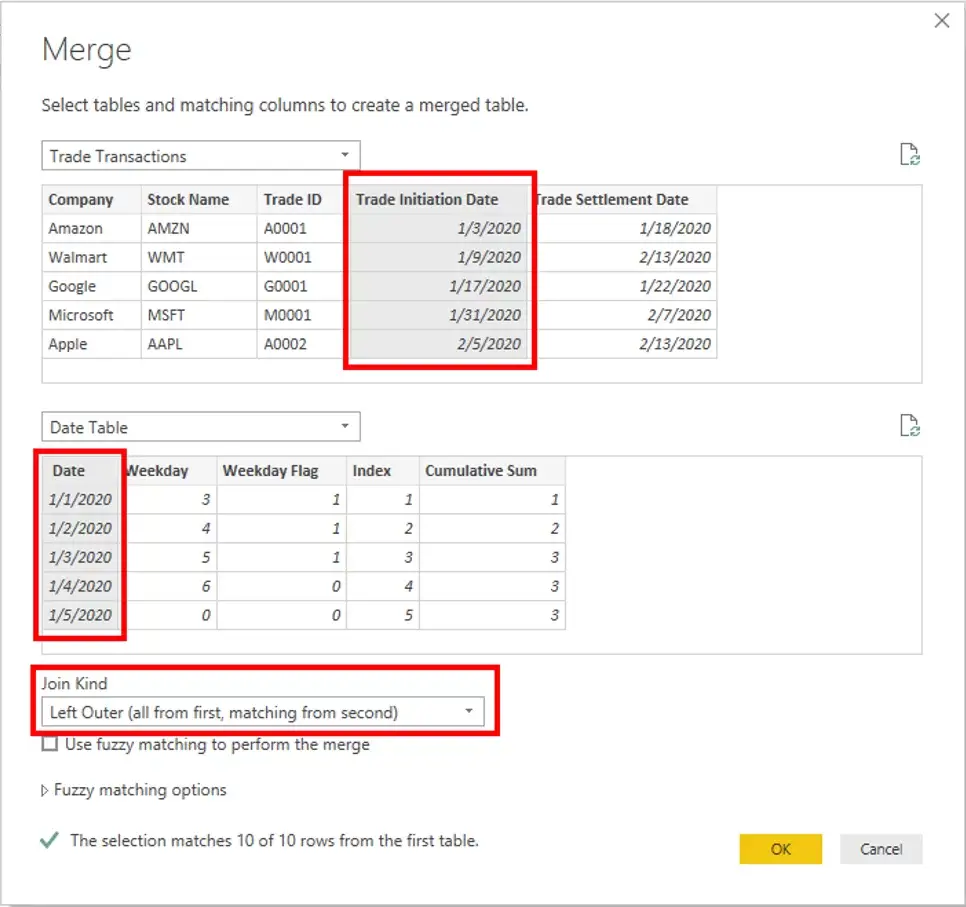
There will be a lot of additional columns. We only need to keep the Cumulative Sum field from the Right Table (Date Table).

We can rename it as Initiation Date Number.
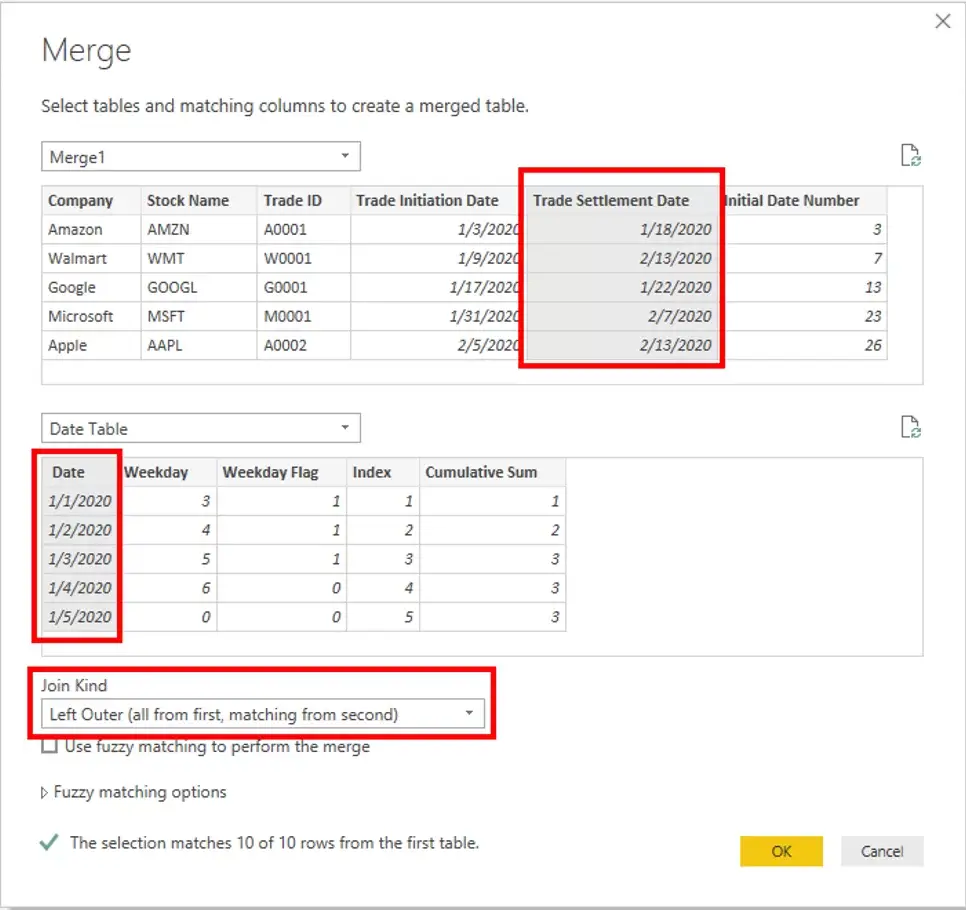
9) Now, we need to merge the Merge1 (result of the first join) with the Date table as a Left Join on the Settlement Date and the Date field to get the Settlement date number. This will be the Second Join.
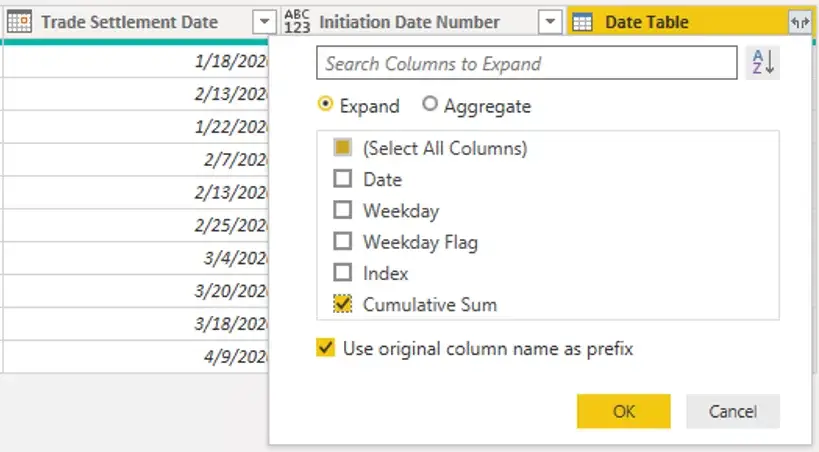
Same as the previous step, we can get rid of the unwanted fields and keep only the Cumulative Sum field and rename as Settlement Date Number.

10) Now, for the final step. A simple subtraction Calculation to find the Business Age.
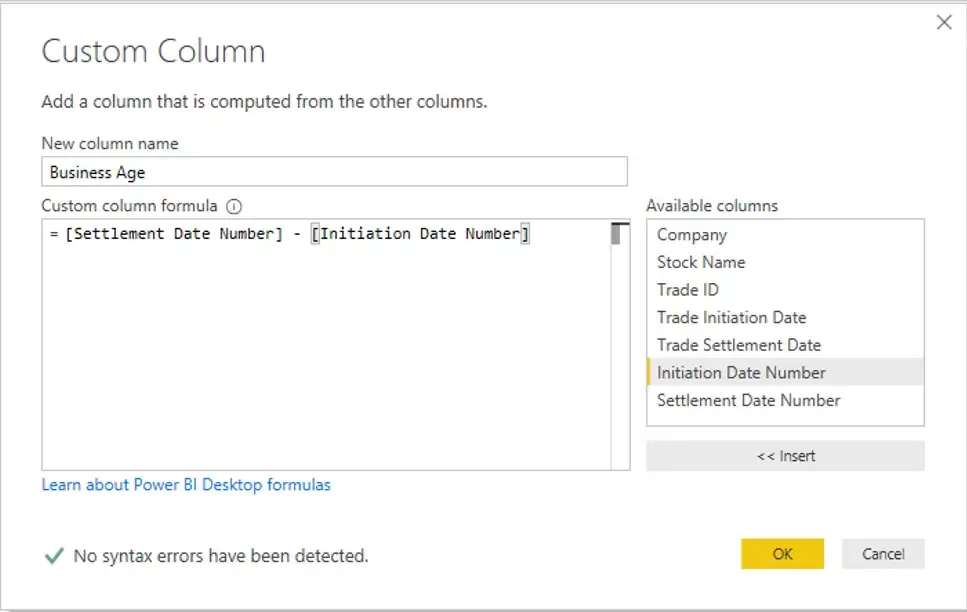

This completes all the steps of Method 1.
Method 2
In this method, we will create 2 Date tables (both having the same logic), one for Initiation Date and one for the Settlement Date. Then we will create a relationship between the Transactions table and each of the Date tables. Finally, we will create a DAX calculation to find the Business Age.
The initial steps are same as Method 1. The other steps will be performed in the Report View window using Calculations.
1) Starting by connecting to the Trade Transactions file.
2) Create the Date Table through the Blank Query option using the List.Dates function.
3) Create the Weekday field and identify the Weekday Flag through a conditional column.
4) Add the Index Column and create the Cumulative Sum using the List. Sum and List.Range functions.
5) Now that the Date Table is ready, we need to create a Duplicate of the table and name the fields in the two tables appropriately. The reason to do this is because we are using the Relationship approach. In Power BI, the same table cannot be used for relationship with two fields. (Unlike Method 1 where the same table was joined twice).
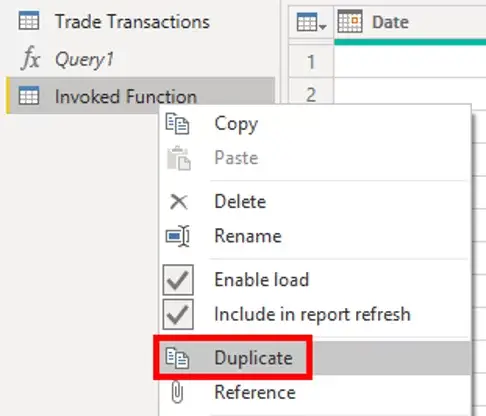


Now we can apply all the changes and go to the Report View.
We can see all the tables and fields needed for our calculations. We don’t need some fields. We can eliminate them in the Query editor or here in the Field pane.
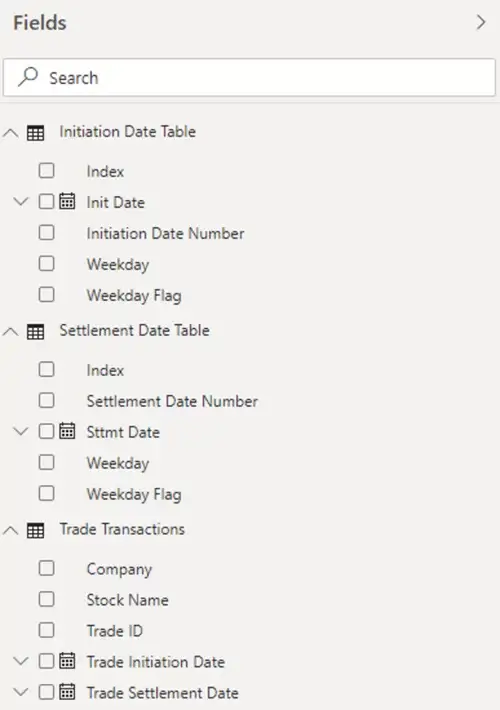
6) Now, we need to create a Relationship between the tables. We will go with Many to One (M-1) relationship between Transactions table and Date tables.
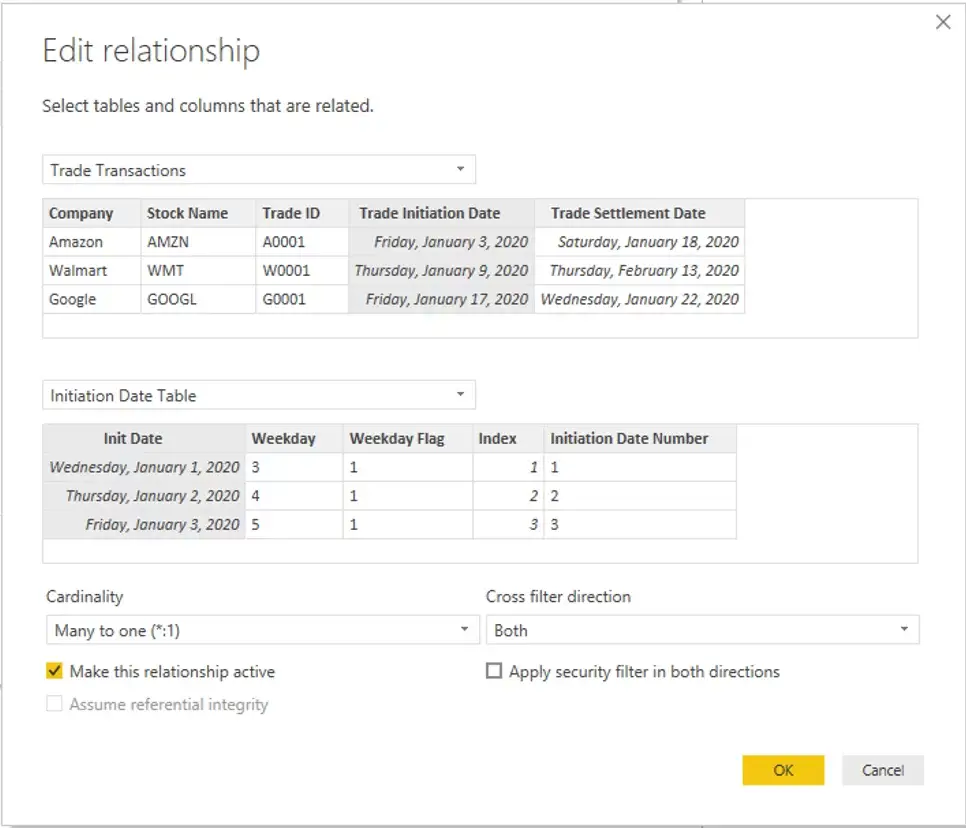
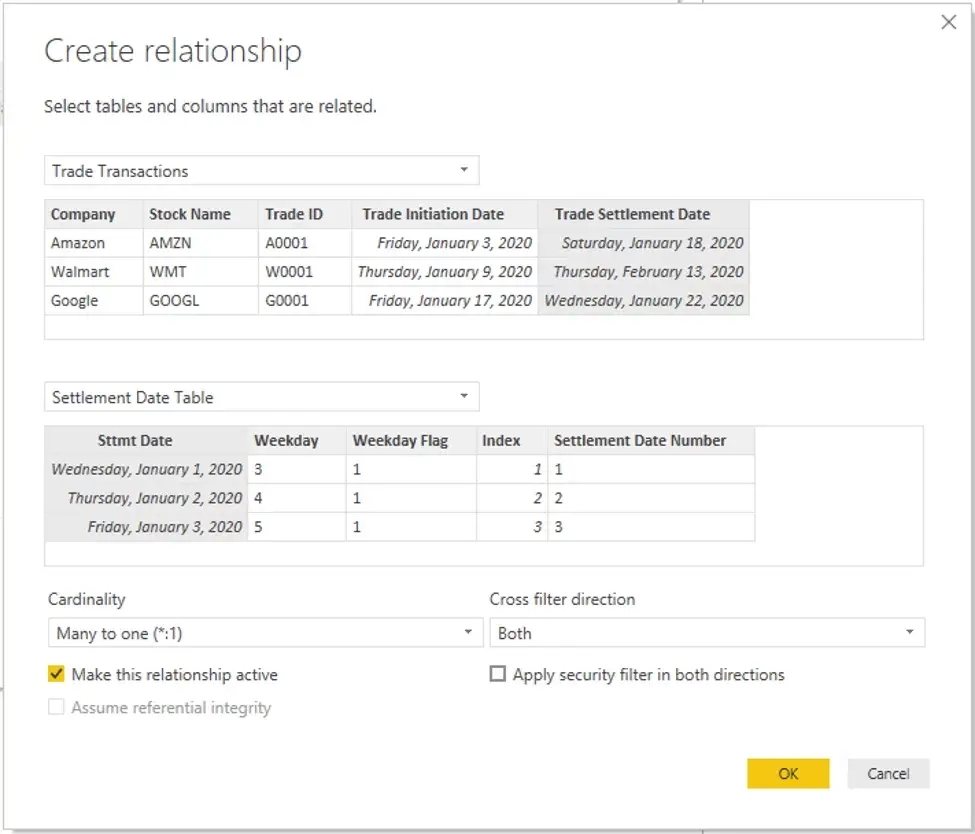
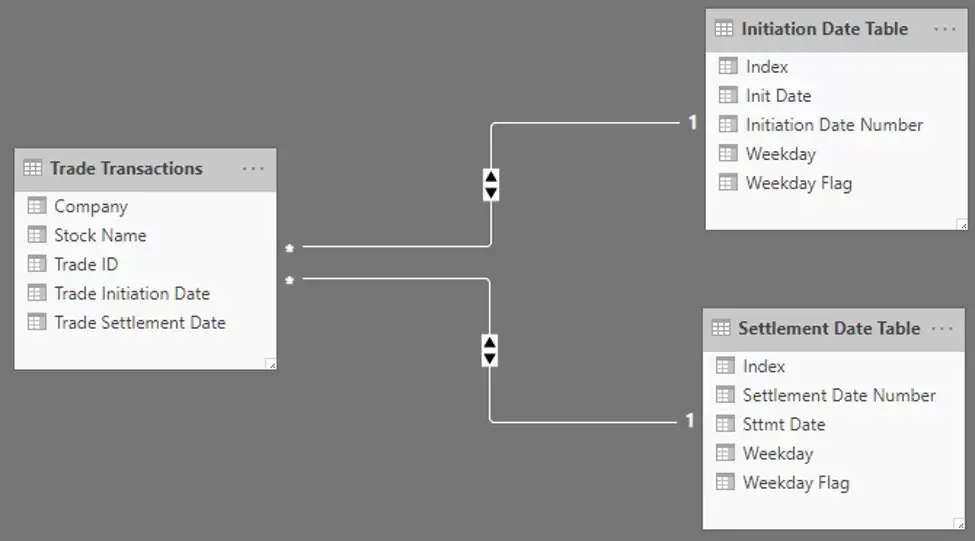
7) The next step would be to subtract the Initiation Date Number from the Settlement Date number. But the fields are not present in the Transactions table. We need to remember that this is not a join, its only a relationship. So, all the fields are not in the same table. So, we need to write two DAX calculations with the RELATED function.
ColumnInit = RELATED(‘Initiation Date Table'[Initiation Date Number])
ColumnSttmt = RELATED(‘Settlement Date Table'[Settlement Date Number])
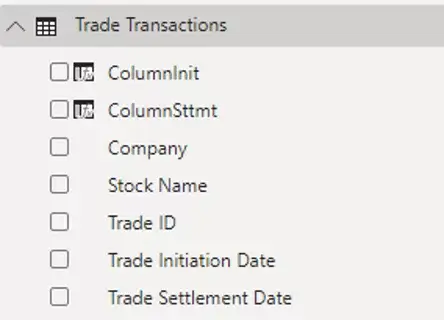
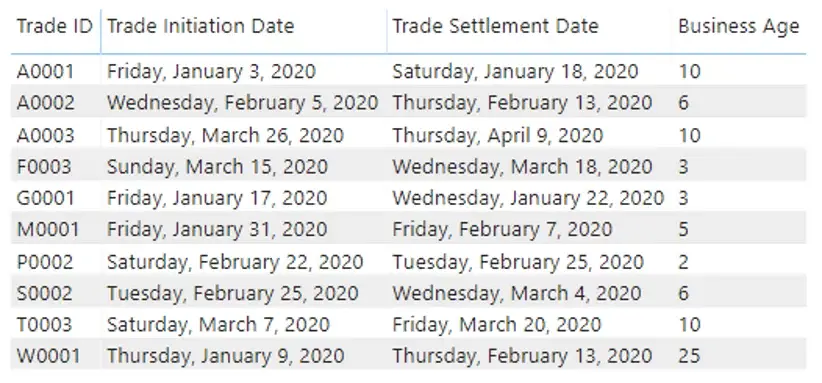
8) Now, we can subtract these two columns to find the Business Age
Business Age = ‘Trade Transactions'[ColumnSttmt]- ‘Trade Transactions'[ColumnInit]
We can build a simple table to show the numbers. We can format the decimals and remove the total is needed. This is just a verification step.


 Media Coverage
 Press Release
