Using Calculation Groups to Streamline KPI Tracking
Optimizing Power BI for KPI Analysis
Simplifying Complex Metrics with Calculation Groups in Power BI
Benefits of Using Calculation Groups in Power BI
Step-by-Step Guide to Setting Up Calculation Groups
Enhancing KPI Management in Power BI Dashboards
Best Practices for Managing KPIs with Calculation Groups
Defining Key KPIs for Business Insights
Configuring Calculation Groups for KPI Efficiency
Improving Data Analysis Performance
Troubleshooting Calculation Group Issues
In this blog, we explore how Power BI’s calculation groups feature enabled us to address a complex reporting challenge within a healthcare KPI dashboard project. The task initially involved arranging multiple KPIs across various time periods within a matrix visual. A significant new requirement soon emerged: to display only the percentage change for prior-year (PY) metrics in a column adjacent to current-year (CY) values. This new requirement would have been challenging to implement efficiently without calculation groups. Here’s how we used this powerful feature to simplify our solution and streamline the process.
The Challenge
During this recent project, we were tasked with developing a healthcare KPI dashboard that featured various key metrics organized in a matrix visual. The initial setup involved displaying KPIs for different time periods in separate rows, making it straightforward to compare metrics across time.
As shown below in image using an example of Sample Dataset.
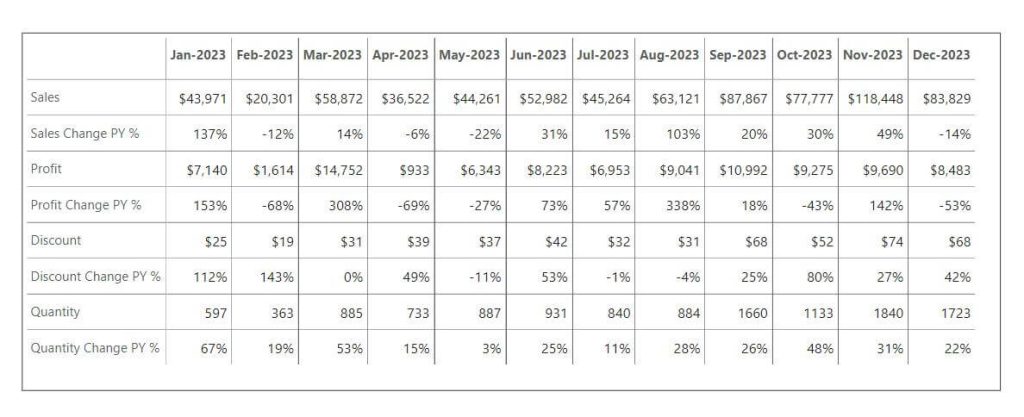
However, as the project progressed, a new requirement surfaced: we needed to display prior-year (PY) percentage changes alongside the current-year (CY) values in a single column.
As shown below in image using an example of Sample Dataset.

The challenge was not just about adding another layer of information but doing so in a way that maintained clarity and usability. Without calculation groups, this would have entailed creating multiple distinct measures for each KPI and time period. For instance, we would have needed separate DAX measures for current-year values, prior-year percentage change calculations. Managing these measures would have been cumbersome and prone to errors, leading to a cluttered model and making future adjustments more difficult.
The key was to find a solution that allowed us to integrate this new requirement seamlessly while keeping the model efficient and easy to maintain. Calculation groups in Power BI offered a streamlined approach to address this challenge, providing a way to dynamically calculate and display the required percentage changes without the overhead of numerous individual measures. Here’s how we implemented it:
1. Setting Up the Calculation Group:
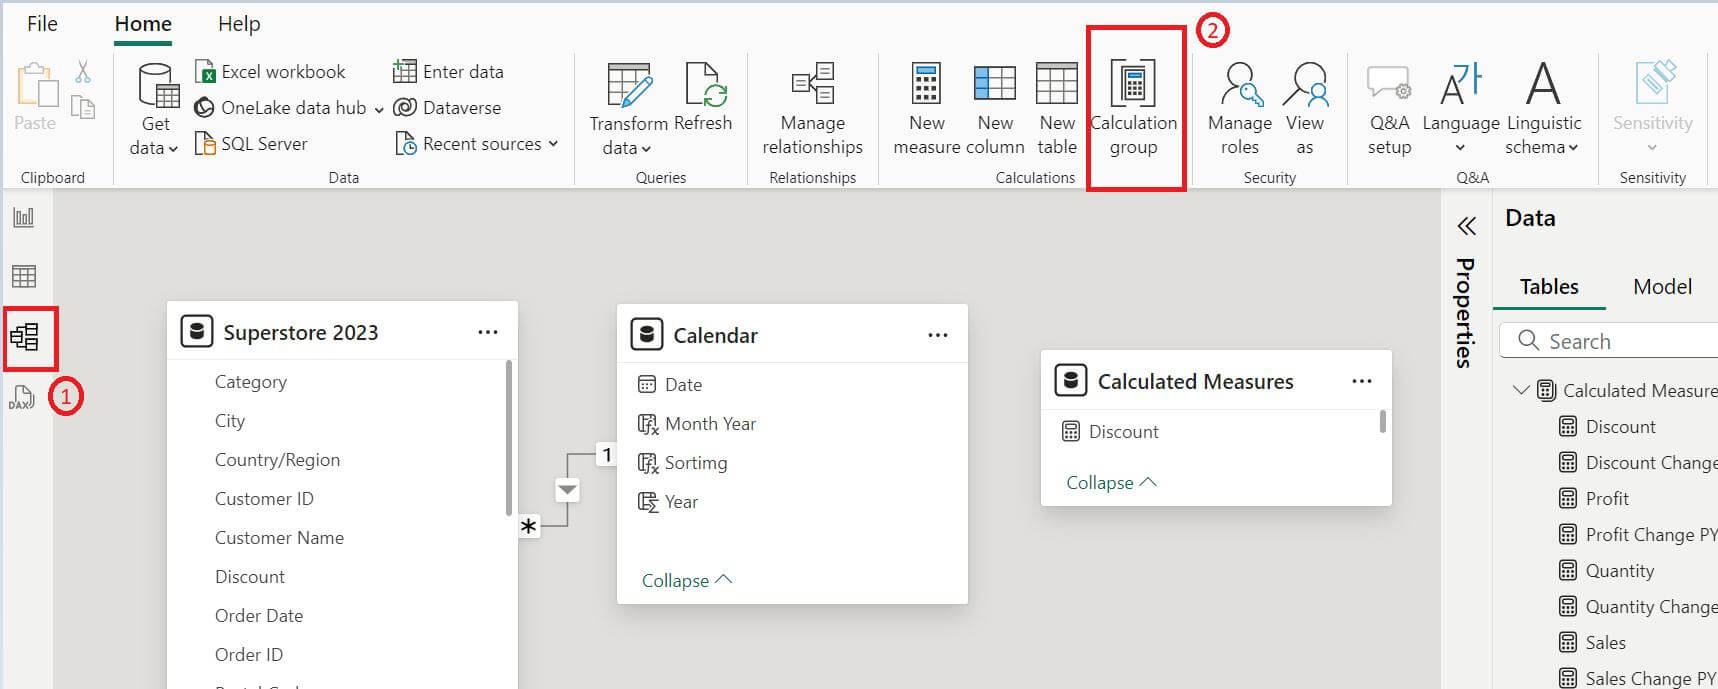
To set up a calculation group first go to the model view (1) and then click on Calculation group(2). As shown in the image below:
2. Add Calculation Items:
Step 1
The moment you click on Calculation group , a calculation items (3) group will pop up with one Calculation Item = SELECTEDMEASURE() in formula section (4). As shown in the image below:
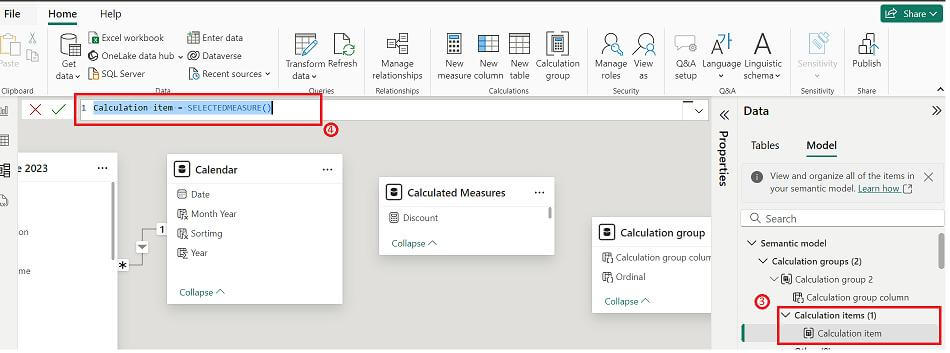
Now you can change the Calculation Item name to CY (or anything as per your requirement) (5). As shown in the image below:
(Note: SELECTEDMEASURE() returns the value of the currently selected measure in the context of the calculation group, allowing dynamic application of the calculation across different metrics.)

Step 2
Now to calculate Prior Year Change %, we will add one more new calculation item by just clicking on three dots on to the right of Calculation Items. As shown in the image below:
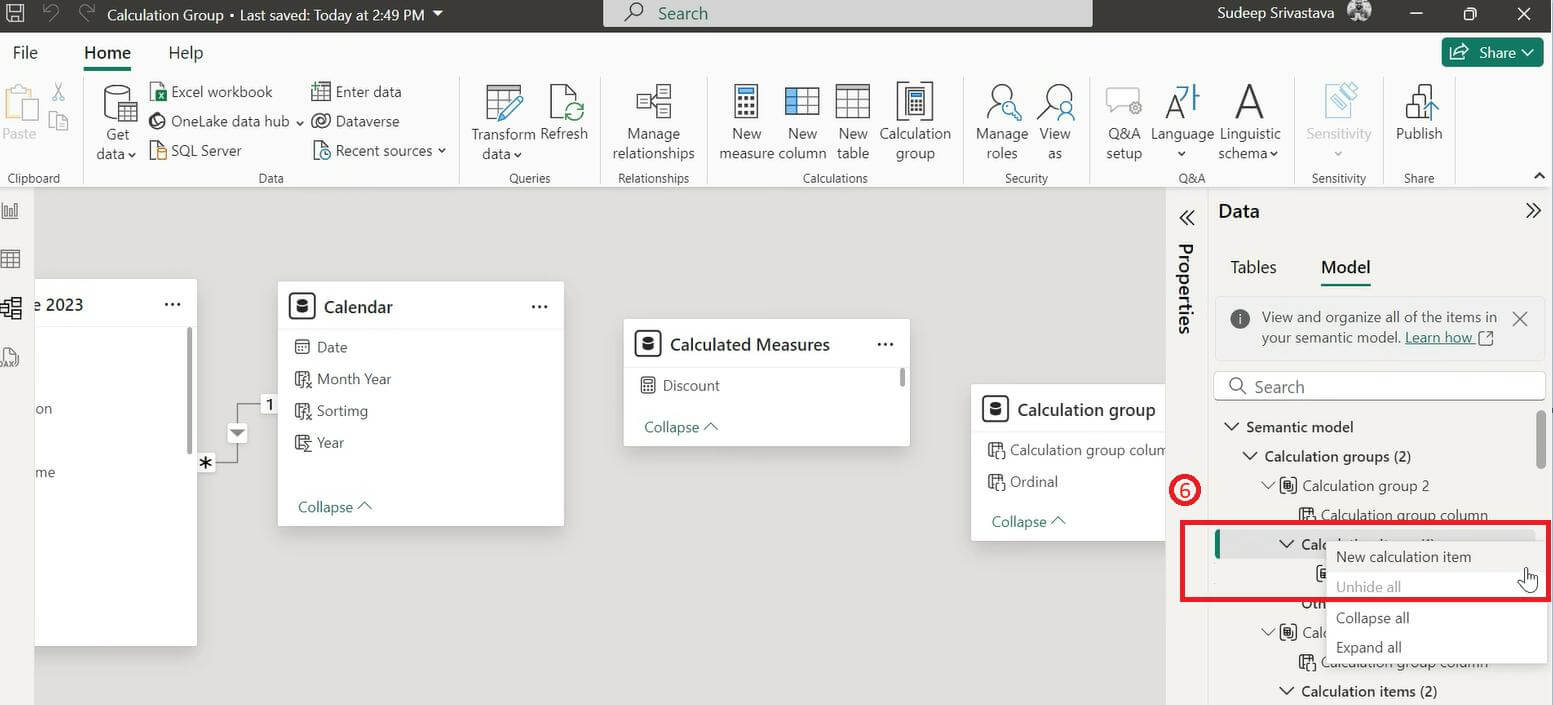
The moment you click on New Calculation Item a formula window will pop up where you can put the calculation for Prior Year (PY) % Change (7). As shown in the image below:

3. Apply the Calculation Group:
Once the calculation group is set up with the necessary items and DAX formulas, apply it to your matrix visual, by placing calculation group in the columns (8) and then click on Expand column hierarchy to see the desired output (9).
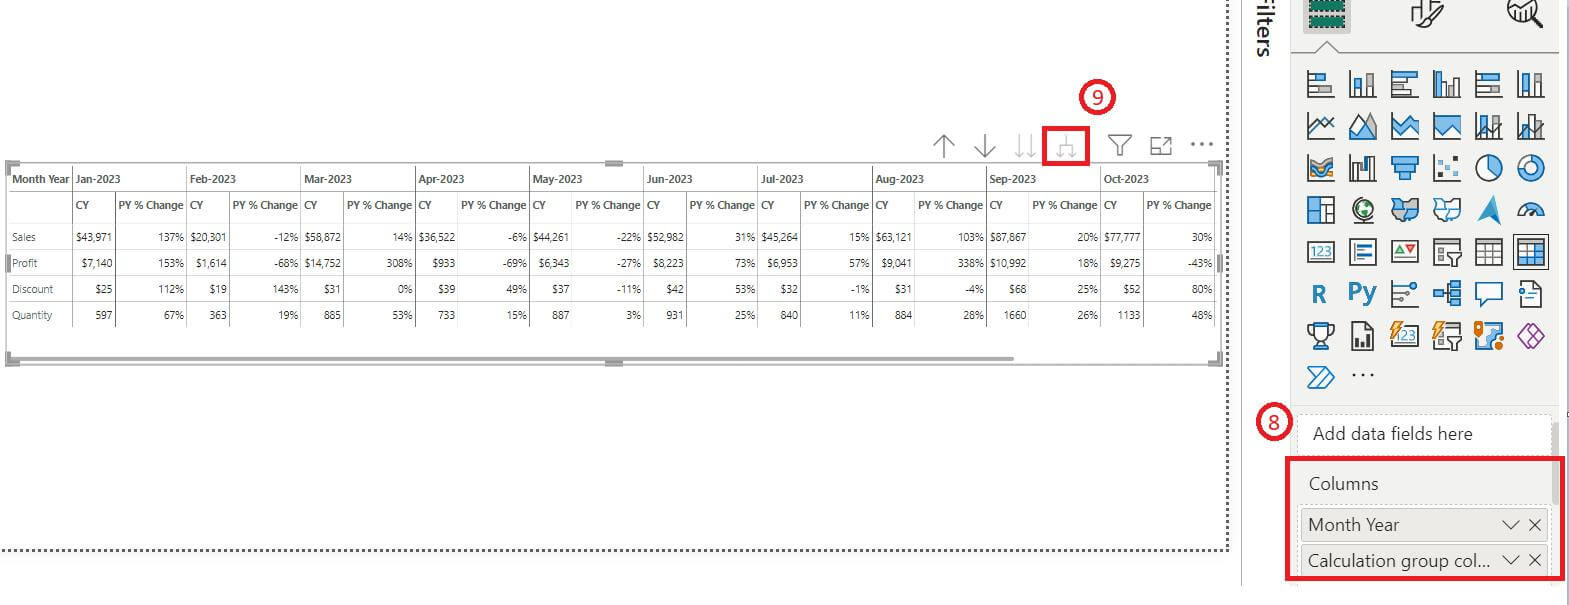
(Note : To get the values in the above format make sure to turn on the “Switch values to rows” option. As shown in image below)

Conclusion
Our experience with this project highlights the advantages of using calculation groups in Power BI. By leveraging calculation groups, we were able to streamline the healthcare KPI dashboard, enhancing ease of maintenance, scalability, and overall usability. Not only did calculation groups save valuable time, but they also enabled us to deliver more meaningful insights to stakeholders efficiently. This feature proves to be a significant asset in managing complex reporting requirements while maintaining model clarity and performance.


