Mastering Dynamic Sorting: A Comprehensive Guide for Tableau Users
Unlocking Interactive Dashboards: Dynamic Sorting with Parameters in Tableau
Elevate Your Data Visualization: Implementing Dynamic Sorting in Tableau Dashboards
The parameter is one of my favorite tools to use when developing dynamic Tableau dashboards. For those who are not familiar, a parameter is a workbook variable such as a number, date, or string that can replace a constant value in calculations, filters, reference lines, and more. Parameters give you input control over your visualizations allowing you to dynamically answer ad-hoc and what-if questions. For end-users, this is integral to their analysis as they dive deeper into the visualizations that are provided to them. From a developer’s point of view, parameters are easy ways to give your end-user options – which they love – saving not only development time but space on a dashboard.
Understanding Dynamic Sorting: Introduction to Sorting Techniques with Parameters in Tableau
Step-by-Step Tutorial: How to Implement Dynamic Sorting Using Parameters in Tableau
Advanced Techniques: Enhancing Interactive Dashboards with Dynamic Sorting in Tableau
Tips and Tricks: Best Practices for Dynamic Sorting Implementation in Tableau
As with any feature, there are always pros and cons. This blog is not going to go through all the potential pros and cons of using parameters but rather provide a solution to what some – including myself previously – might view as a “con” to using a parameter to swap dimensions.
One of the most common options that end-users look for is having the ability to choose from a list of dimensions, giving them flexibility on how to slice and dice their data. We’ve seen it all before, with IF/ELSE or CASE statements that allow an end-user to see total sales broken down by Category, or Sub-Category, or Segment, etc.
The issue is not with how to swap dimensions – that’s an easy implementation. The issue lies in wanting to change the sort based on the dimension selected via the parameter. What if I wanted to have a specific manual sort for each individual dimension selection? What is the easiest way I can ensure that my dimension domain members are sorted in the correct way based on my parameter selection?
The following is just one example in which one can dynamically sort different dimensions and their domain members. This method can be utilized in many ways.
Creating Dynamic Parameters: Setting Up Parameters for Dynamic Sorting in Tableau
Implementing Dynamic Sorting: Configuring Sort Options for Interactive Tableau Dashboards
Enhancing User Experience: Enabling Dynamic Sorting Features for Improved Data Analysis
Maximizing Flexibility: Customizing Dynamic Sorting Options for Tableau Dashboards
To follow along, please feel free to download the dashboard used in this example here.
To keep it simple, I am using a mock dataset that includes details for individual loans. I already have a parameter and calculation created that allows the end-user to swap between the dimensions below:
- Origination Date (origination date of the loan)
- Loan End Date
- Risk Segmentation (is the loan high, medium, or low risk of default)
- FICO Score
Choose Row Breakdown (Parameter)
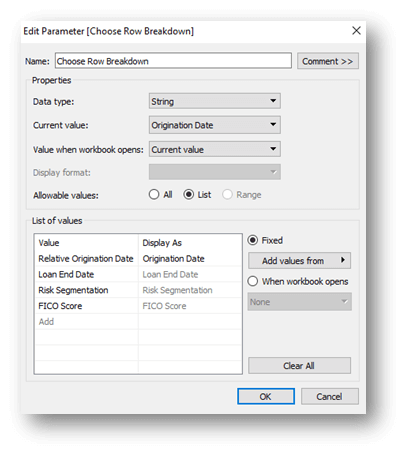
Chosen Row Breakdown (Calculation)

As you can see from the screen below, there are issues with how my data is currently sorted.
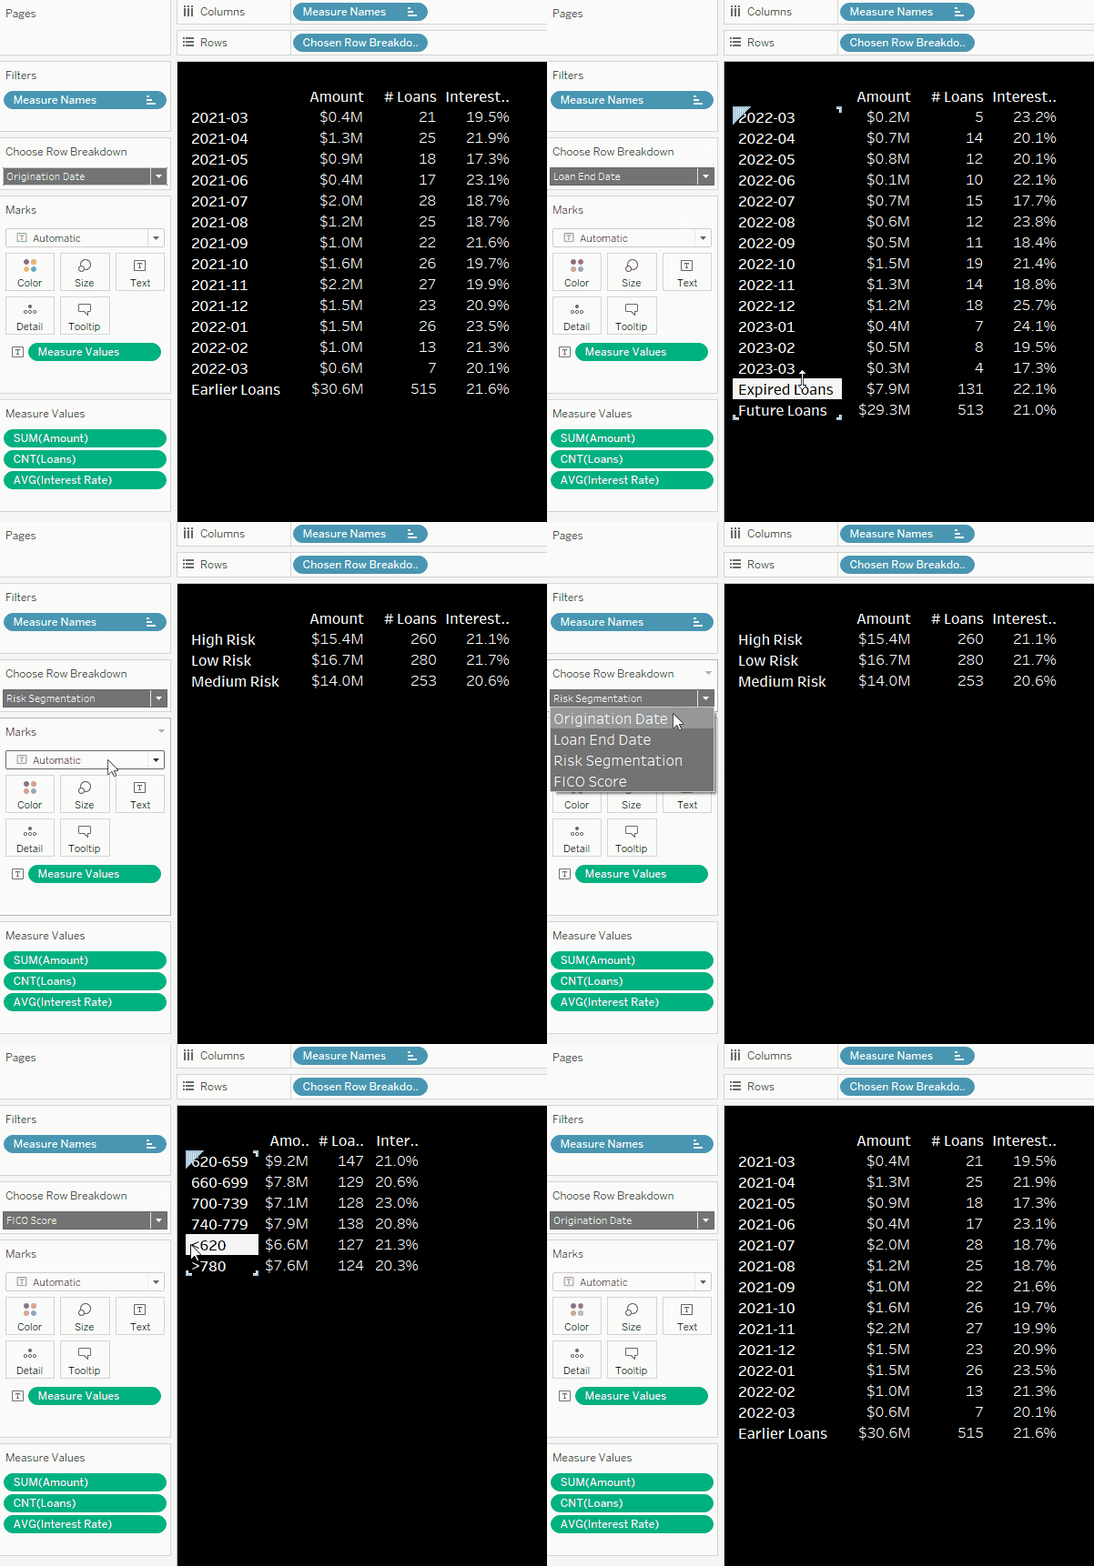
The following steps are going to ensure each dimension is sorted correctly.
Step 1: Identify the data types of each field
This step is a must as it will determine how one proceeds. In the end, I will need to have all my “sort” fields be the same data type. In my example, I have a two date fields (Origination Date and Loan End Date) and two string fields (Risk Segmentation and FICO Score).
Step 2: Identify how your end-user would like these values displayed? In what order? Are any fields grouped a certain way?
In the example, the end-user wants each field sorted the following way with certain provided requirements:
Origination Date
Requirements: Ascending order so that the most recent date is displayed at the bottom. Only display the date if it is within the last 13 months. If the origination date goes back further than 13 months, bucket as “Earlier Loans”.
Keep in Mind: If I were just using/displaying this as a date field, then this would be an easy sort, but the end-user wants certain dates bucketed into an “Earlier Loan” bucket. This means that the resulting field is going to need to be a string.
Loan End Date
Requirements: Ascending order so that later dates are displayed at the bottom. Only display the date if it within the current month and 13 months from now. If the loan end date has past, bucket as “Expired Loans”. If the loan end date is further than 13 months in the future, bucket as “Future Loans”.
Keep in Mind: Like the Origination Date field, this will ultimately result in a string field.
Risk Segmentation
Requirements: High should come first/at the top and Low last/at the bottom.
Keep in Mind: This is already a string field, but I cannot sort alphabetically/in data source order. That would result in High, Low, Medium – which would not fit the requirement.
FICO Score
Requirements: Ascending order with lowest FICO score bucket at the top and highest at the bottom.
Keep in Mind: This field is already a string field as there are buckets of scores (e.g., <620, 620-659, etc.). I cannot sort alphabetically/in data source order because it would result in “<620” and “>780” displaying at the bottom – which would not fit the requirement.
Step 3: Prepare any calculations prior to creating a specified sort field for each
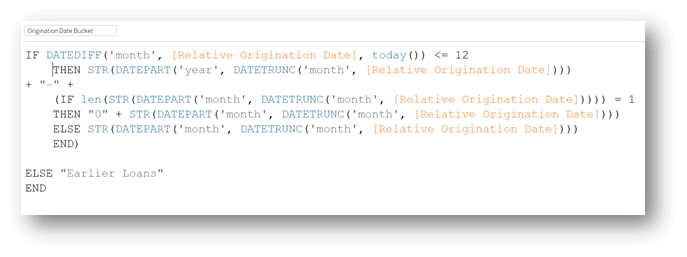
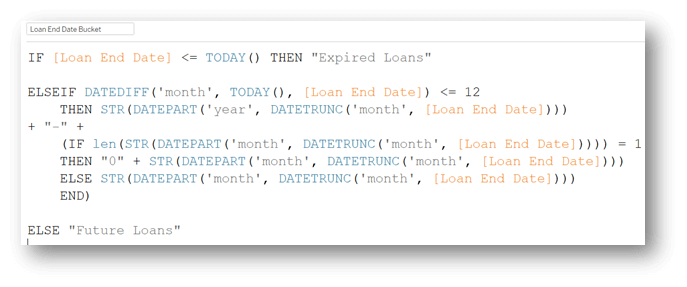
I need to first create Origination Date and Loan End Date bucketed fields to account for the requirements that were given. I have created two fields, each resulting in a string output, that I can use in the visualizations going forward:
*Be aware that these calculations are created so that the string output is in an easy-to-read date format:
Origination Date Bucket
Loan End Date Bucket
Step 4: Create “sort” calculations for each of your fields that need a custom manual sort.
This step is use-case informed. In the example, I am trying to sort string fields in a certain manual order and each of them needs some sort of custom sort. I cannot depend on the default sort order.
I’ll take this field-by-field:
Origination Date Bucket Sort
For Origination Date Bucket, I want “Earlier Loans” to be the first at the top, then each date following to be in ascending order.
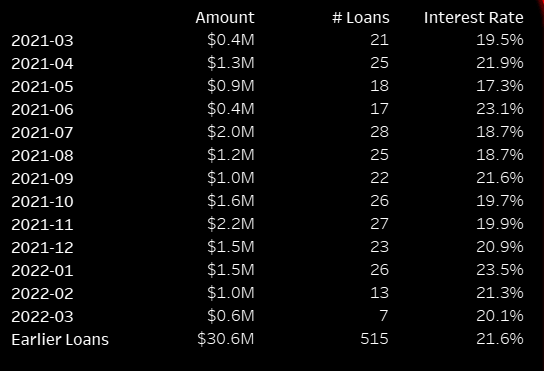
I only need to adjust where “Earlier Loans” lays in this order, so I’ll assign it a custom value:

*The STR(-999999999999) value here is just me being certain that it shows up first. I could’ve just put something like STR(-1) or “*”
Loan End Date Bucket Sort
For Loan End Date Bucket, I want to see “Expired Loans” at the top, followed by the dates for within the 13-month window, then “Future Loans” at the bottom.

Risk Segmentation Sort
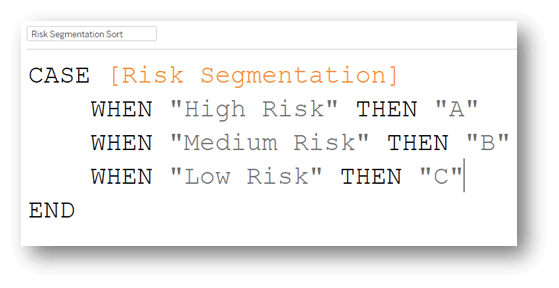
For Risk Segmentation, I want to see “High Risk” at the top and “Low Risk” at the bottom so I’ll give them a value to sort by.
FICO Score Sort
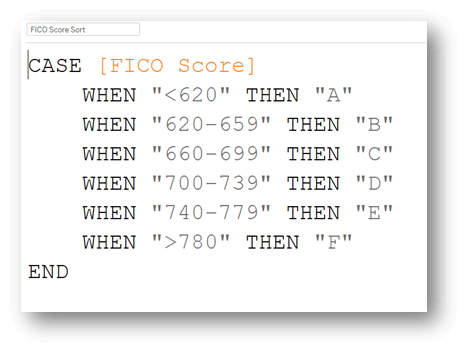
I’ll just give my own sort order to each of these bucket values so I can ensure they are being displayed in the correct order.
Step 5: Create the dynamic sort calculation that will swap which sort to use
Now that I have all of the “sort” fields created, I need to be able to switch which “sort” calculation I am using depending on what value is selected in the parameter. Similar to how I’ve used IF/ELSE or CASE statements to switch which dimension I am displaying, I’ll now create one to switch amongst my “sort” fields:
Chosen Row Breakdown SORT

Step 6: Define the sort!
Now that I’ve created the dynamic sorting field, I can use it when defining/applying a sort to the [Chosen Row Breakdown] field. Settings for this sort are shown below:
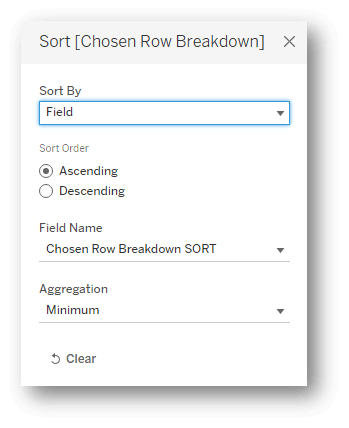
With this, I have my sorts fixed on my sheet!
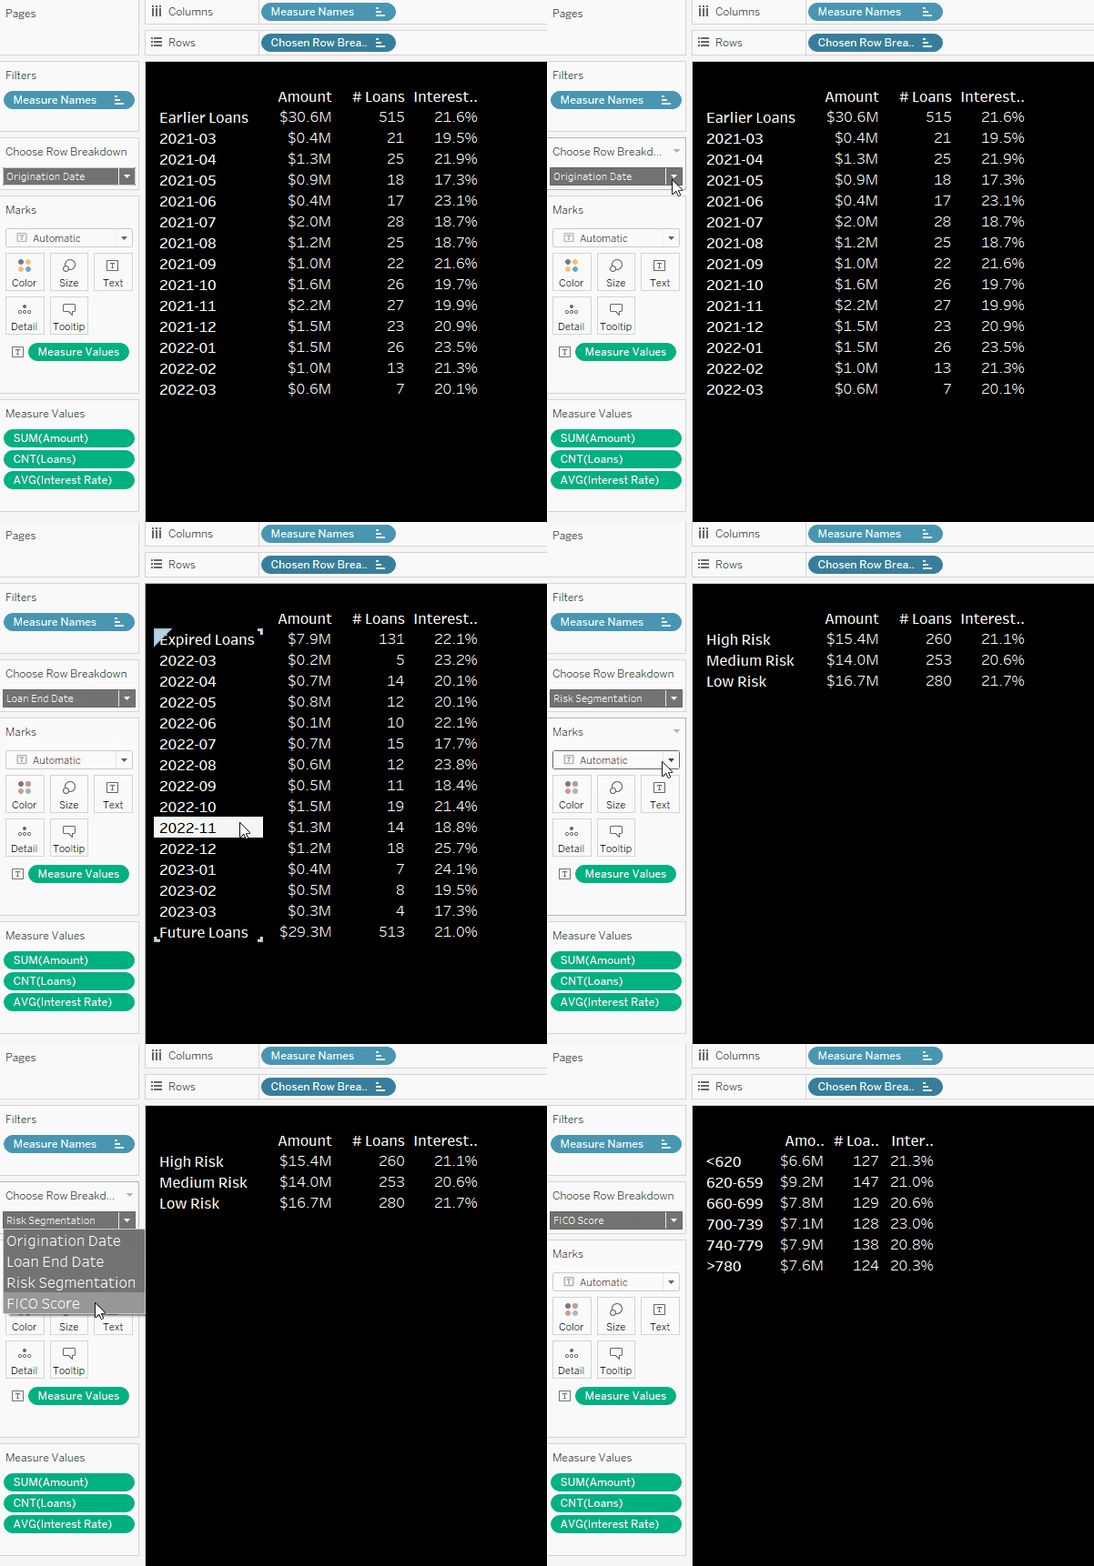
While there are many ways – and possibly more efficient ways – to implement this method, hopefully you are now less hesitant from using a parameter to switch between dimensions because of the sort involved. You can now use this method to create dynamic views.


