Unveiling Pokémon GO’s Virality: A Data Visualization Showcase
Pokémon GO Data Visualization: Capturing the Game’s Viral Impact
Exploring Pokémon GO’s Viral Phenomenon: A Visual Journey
To most people, Pokémon Go is the biggest mobile game of 2016 and the first real breakthrough hit in the augmented reality genre. To Swiss artist and data scientist Kirell Benzi it’s an example of viral behavior in action.
As a researcher completing a network science Ph.D., Benzi decided to create a stunning data-viz to illustrate just how massive Pokémon Go became — with its 100 million+ downloads and around 24 million active users. “On an academic level, I was interested in looking at how a network is created and how it evolves over time,” he told Digital Trends. “On the other side, it was a piece of art.”
Understanding Pokémon GO’s Popularity: Insights from Data Visualization
Analyzing Gaming Trends: Visualizing the Virality of Pokémon GO
Pokémon GO Virality: Insights from Data Science Artists
Visualizing the Impact: Pokémon GO’s Journey to Viral Fame
Visualizing Pokémon GO’s Reach: Exploring User Engagement through Data
Capturing Pokémon GO’s Cultural Impact: Insights from Data Visualization
Pokémon GO Analytics: Uncovering Trends and Patterns through Visualization
Harnessing Data Visualization for Pokémon GO Analysis: Techniques and Tips
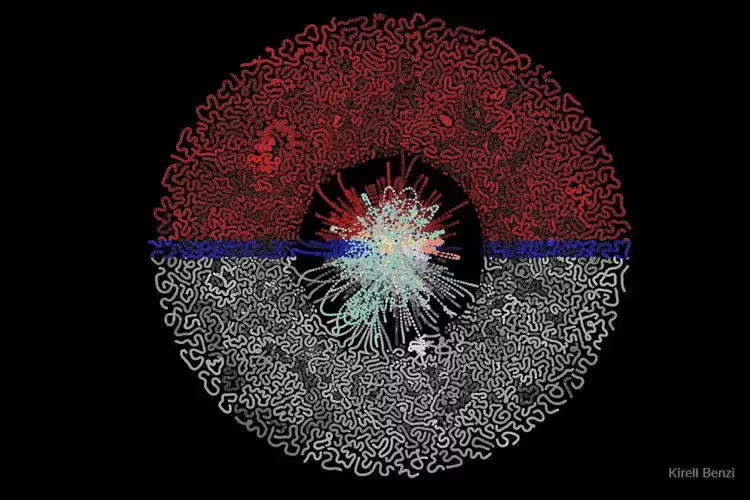
What Benzi’s interactive creation shows is an example of what it looks like when a hit the size of Pokémon Go arrives online. Scraping YouTube playlists for mentions of the words “Pokémon” or “Pokémon Go,” he cataloged almost 50,000 videos which have appeared online since the app made its stunning debut.
Each node on the data visualization represents a video of Pokémon Go, with the center of the infographic illustrating the most popular videos and the ones on the periphery being less popular. Videos are linked together when they are consecutive to one another in playlists. Color shades are also directly proportional to the number of views of the playlist, with the height (z-coordinate) proportional to the number of views a video received.

CLICK HERE TO WATCH THE FULL VISUALIZATION
Best of all, it even looks like a Pokéball, due to his clever use of color and an, ahem, “Scalable Force Directed Placement (SDFP) graph layout algorithm.”
“We don’t really have many data sets that show this kind of virality right now,” Benzi continued. “To capture the data, you have to be there right at the beginning, because you want to show how it evolves over time. If you start after something has already gotten big, you don’t have the timeline to see how it grew to that point.”
So just what made Pokémon Go such a smash hit from a viral point of view? “Part of it, I think, was that the way of playing was totally new to people, so early on a lot of people were going online to work out how to play the game,” Benzi said. “These tutorials helped drive the hype. It was also a very social experience which helped drive the viral nature of Pokémon Go. It’s different to, for instance, a movie, where you’re a passive consumer, and aren’t expected to participate in it as a social actor.”
Over time, the plan is to follow up with the study of other viral phenomena. The comparison promises to be fascinating as it will unravel just how ideas raise themselves in the public consciousness and then fade away again.
Thanks to his quick-thinking in capturing the entire Pokémon Go story, Benzi — whose work you can follow via his website and Facebook account — has been there to document the whole story.


