Demystifying Data Observability: A Comprehensive Guide for Data Teams
Unlocking Data Insights: The Role of Observability in Modern Data Environments
Elevate Your Data Game: Implementing Data Observability for Better Insights
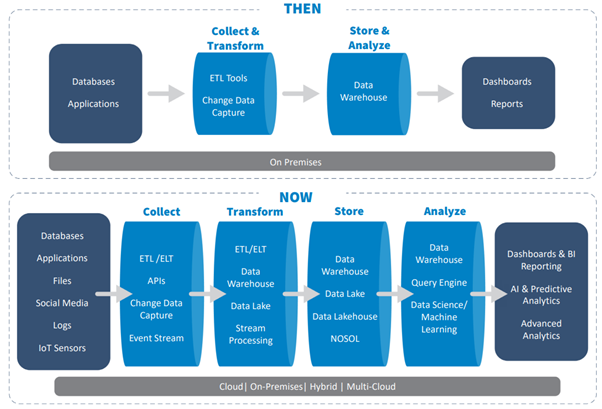
In the past, data infrastructure was built to handle small amounts of data–usually operational data from a few internal data sources–and it wasn’t expected to change drastically. However, in the recent past, organizations rely on data both from internal and external sources, and the sheer volume and velocity at which this data is collected can cause unexpected drift, schema changes, transformations, and delays.
Modern data stacks provide a wide variety of functionality, allowing users to store and query data in multiple ways. The more the functionality incorporated, the larger the complexity to just keep the platform functional. This complexity continues to grow given that one has to deal with
- More external data sources
- More complicated transformations
- Sharpened focus on analytics engineering
Downstream reporting applications, BI systems rendered from these data platforms are often out of sync with source systems, seemingly unusable by data consumers across the organization. The reason being partial, erroneous, missing, or otherwise inaccurate data. This makes data consumers to lose confidence in their ability to use data in key decision-making processes.
Understanding Data Observability: Key Concepts and Definitions
Implementing Data Observability: Best Practices and Strategies
Real-World Examples: How Data Observability Enhances Data Operations
The Future of Data Observability: Trends and Innovations in Data Monitoring
What Is Data Observability and Why Does It Matter?
Components of Data Observability: Monitoring, Alerting, and Visualization
Best Practices for Implementing Data Observability in Your Organization
Leveraging Data Observability to Drive Data Quality and Performance

Fig 1: Evolution of data stack
Data Quality:
Data quality measures the condition of a set of data—how well suited it is for an organization’s needs. As rightly believed, high-quality data is far more reliable and readily available for use as compared to poor, low-quality data. Organizations constantly strive to improve the data quality.
In this direction, most organizations will measure data quality along these six distinct dimensions:
- Accuracy, or how many errors contained within a given dataset. To measure accuracy, datasets are compared to a reference dataset.
- Completeness, or whether all critical fields are corrected captured? To measure completeness, calculate the percentage of records containing incomplete/partial data.
- Consistency, or whether similar data pulled from two or more datasets agree with each other. Inconsistent data indicate inaccuracies in one or more datasets.
- Timeliness, or how recent is the data? Recent/fresh data tends to reflect business changes more accurately.
- Uniqueness, or whether there are any duplicates in a data set. Merge or purge duplicate data, as appropriate.
- Validity, or how well data conforms to standard formats. It’s difficult to use data if it is in the wrong format
However, the concept of data quality is also a reactive process and does not save us from the damages which can happen to downstream applications. This creates an opportunity to move to a more robust & scalable solution.
Data Observability – A key DataOps process:
Data observability is an organization’s ability to fully understand the health of the data in their systems. It eliminates data downtime by applying best practices learned from DevOps to data pipelines. Data observability tools use automated monitoring, alerting, and triaging to identify and evaluate data quality and discoverability issues. This leads to healthier pipelines, more productive teams, and happier customers.
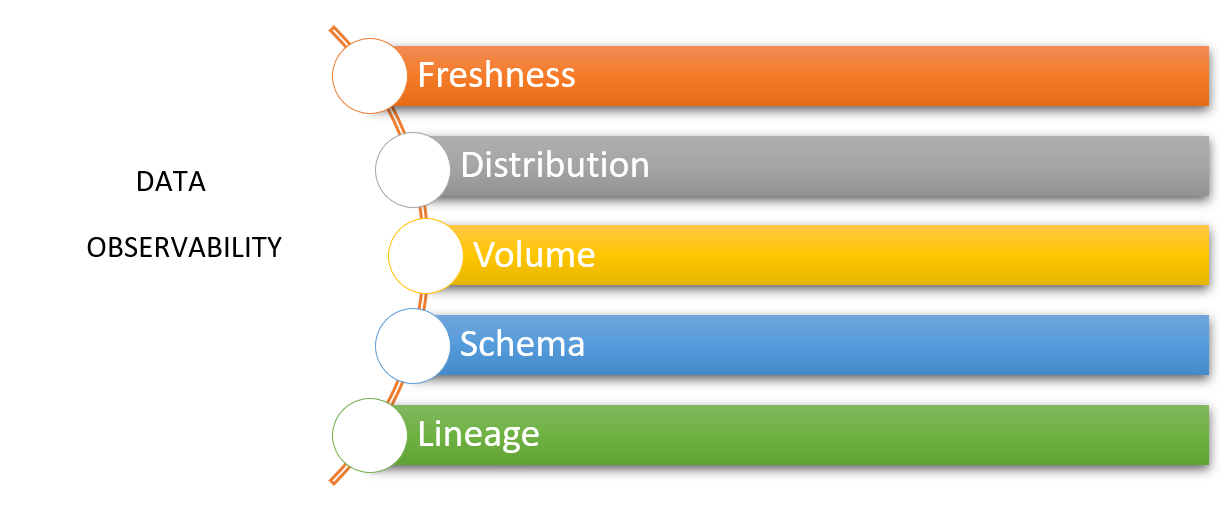
The five pillars of data observability are:
- Freshness describes how current the data is and how often the data is updated.
- Distribution details if data values fall within an acceptable range. Data outside this range may not be trustworthy.
- Volume gauges if data is complete. Inconsistent data volume indicates issues with data sources.
- Schema tracks changes in data organization—who made what changes to the data, and when.
- Lineage records and documents the entire flow of data from initial sources to end consumption.

How Are Data Quality and Data Observability Similar—and How Are They Different?
Both data quality and data observability are concerned with the usefulness of an organization’s data. To this end, they are both immensely important to an organization and complement each other.
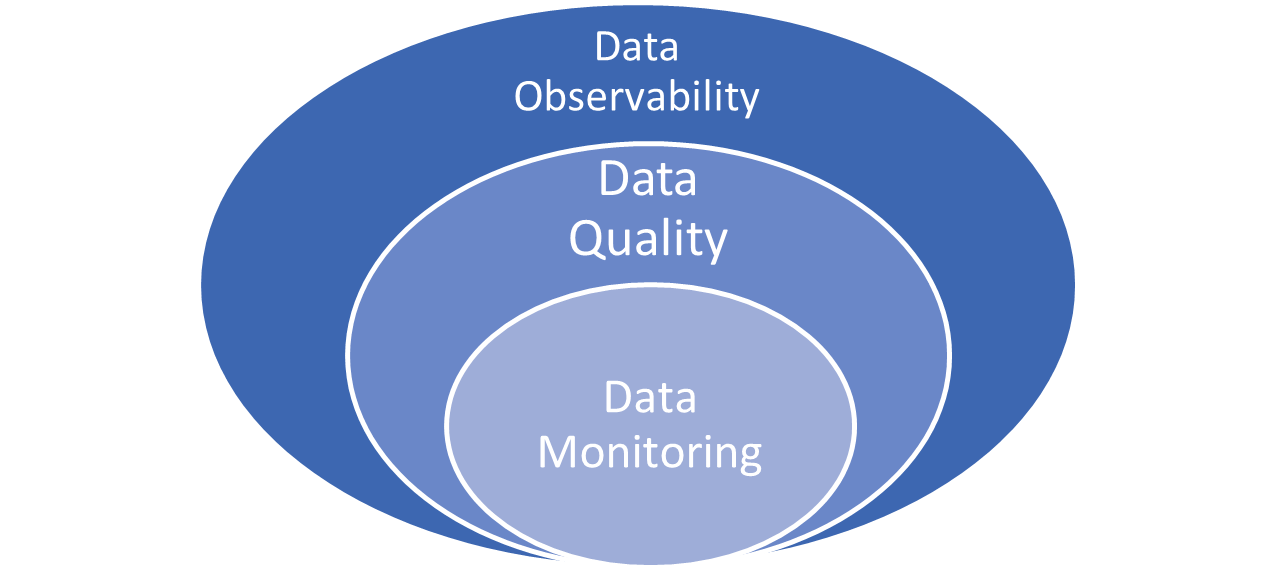
That said, data quality and data observability have slightly different goals. Data quality aims to ensure more accurate, more reliable data. Data observability seeks to ensure the quality and reliability of the entire data delivery system. Data quality is concerned with data itself, while data observability is concerned with the system that delivers that data.
Hence data observability goes beyond just monitoring data and alerting users about data quality issues. Data observability attempts to identify data collection and management issues and fix those big-picture issues at the source. When data observability kicks in, the resultant is better quality data.
Key differences between data quality and data observability mentioned below:
- Data quality examines data at rest (in datasets), while data observability addresses data in motion (through data pipelines)
- Data quality focuses on correcting individual data errors, while data observability focuses on fixing systemic problems.
- Data quality utilizes static rules and metrics, while data observability uses dynamic automated and adaptive rules and metrics.
- Data quality deals with the results of data issues, while data observability deals with the root causes of those issues.
Data Quality Vs Data Observability:
| Key Area | Traditional Data Quality | Data Observability |
| Scope for scanning and remediation | Datasets | Datasets (data at rest), Data pipelines (data in motion) |
| Focus | Correcting errors in data | Reducing the cost of rework, remediation, and data downtime by observing data, data pipelines, and event streams |
| Approach | Finding ‘known’ issues | Detecting ‘unknown’ issues |
| Rules and metrics | Manual static rules and metrics | Automated dynamic, adaptive rules and metrics |
| Root cause investigation | No | Through data lineage, time series analysis, and cross-metric anomaly detection |
| Key persons | Data stewards, Business analysts | Data engineers, DataOps engineers |
| Common use cases | Trusted reporting, compliance [Downstream] | Anomaly detection, pipeline monitoring, data integration [Upstream] |
Where do they overlap?
Data observability and data quality overlap when data observability is used to better data quality. When organizations adopt data observability to enhance data quality, there are bound to be great results. Some of them include
- Cost savings by getting data anomalies before they impact consumers-When an anomaly occurs, the data observability engine alerts the team immediately, allowing time to investigate and troubleshoot the problem before it affects consumers. Since the Data Engineering team is notified of the issue before it involves stakeholders, they could fix their pipeline and avert future anomalies from jeopardizing the integrity of their data.
- Improved collaboration by tracing field-level lineage-data observability helps understand dependencies.
- Raising productivity by keeping tabs on deprecated data sets-data observability gives greater transparency into critical data assets’ relevancy and usage patterns, informing them when different attributes are deprecated.
- Increase cost savings by reducing time to resolve tiresome data fire drills and regain trust in critical decision-making data.
- Better organization between data engineering and data analyst teams to comprehend critical dependencies between data assets.
- Drive greater efficiency and productivity by adding end-to-end visibility into the health, usage patterns, and relevancy of data assets.


