Unlocking Insights: Creating External Reports from Tableau in Metric Insights
A Comprehensive Guide: Generating External Reports from Tableau in Metric Insights
Seamless Integration: Leveraging Metric Insights for External Reporting from Tableau
How to Ingest Tableau Report in Metric Insights
What is Metric Insights?
Metric Insights is an operator of a Business Intelligence Platform used to empower businesses to effectively cut through data clutter. It helps to track metrics from business intelligence tools, big data, and SaaS applications, and uncovers anomalies and notifies users of significant changes in data that requires their attention that enable clients.
Understanding the Power of External Reports in Metric Insights
Step-by-Step Guide: Creating External Reports from Tableau in Metric Insights
Best Practices for Generating Insightful External Reports with Metric Insights
Harnessing the Potential: Tips and Tricks for Creating External Reports from Tableau
Introduction to External Reporting and Its Importance in Business Intelligence
The Process of Creating External Reports from Tableau in Metric Insights
Leveraging Metric Insights Features for Enhanced External Reporting
Enhancing Decision-Making with External Reports: Practical Examples and Use Cases
Why Metric Insights?
Organizations that are struggling with a lack of usage and ROI for their BI practices and the users are overwhelmed with too much information, and they do not know what they can trust. Metric Insights’ Enterprise BI Portal works by integrating all BI tools, reporting, and metrics into a single, consolidated catalogue of governed BI assets that users can access knowing it contains content they can trust.
Steps to Ingest Tableau Report in Metric Insights
1) Create a New External Report (Tableau)
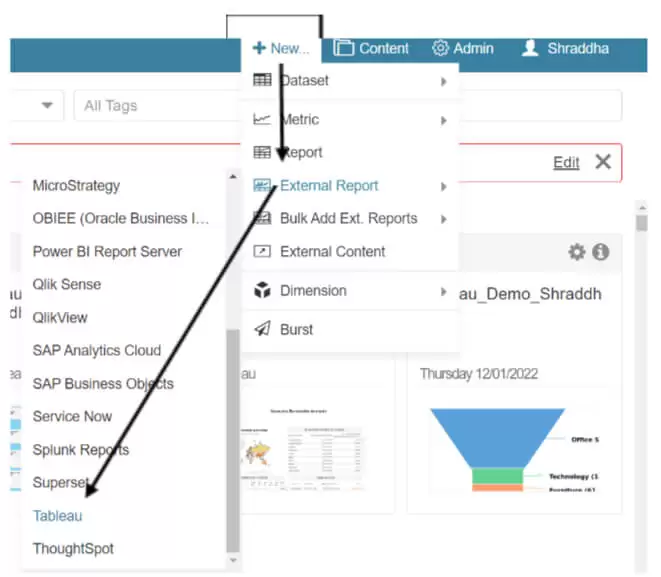
Once you open the Metric Insights Portal, then on the top right corner Under the New tab
1. External Report
2. Choose “Tableau” from drop-down list
2) New External Report page will appear
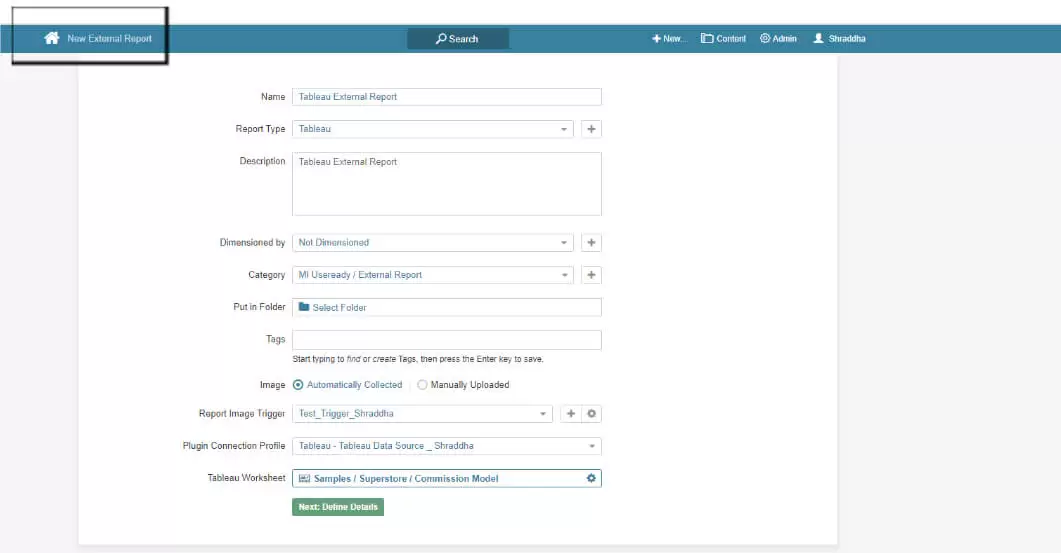
- We must provide unique name for every report
- Report Type is set automatically & according to the selected BI tool
- Description is optional & Visible only if we select Viewer
- Dimensioned by is optional. We can Choose a Dimension to be applied to the Report
- Choose the Category of the Report
- Put in the Folder is optional. Select the Folder in which the Report is included
- Image:
- “Automatically Collected” requires that a Report Image Trigger is set. It defines when the image is updated
- “Manually Uploaded” means the Admin uploads the image manually
- In Plugin Connection Profile, select the Data Source from which the information is collected
- Select the Tableau Worksheet
- Click on Define Details
3) Provide the Required Parameters
Info Tab
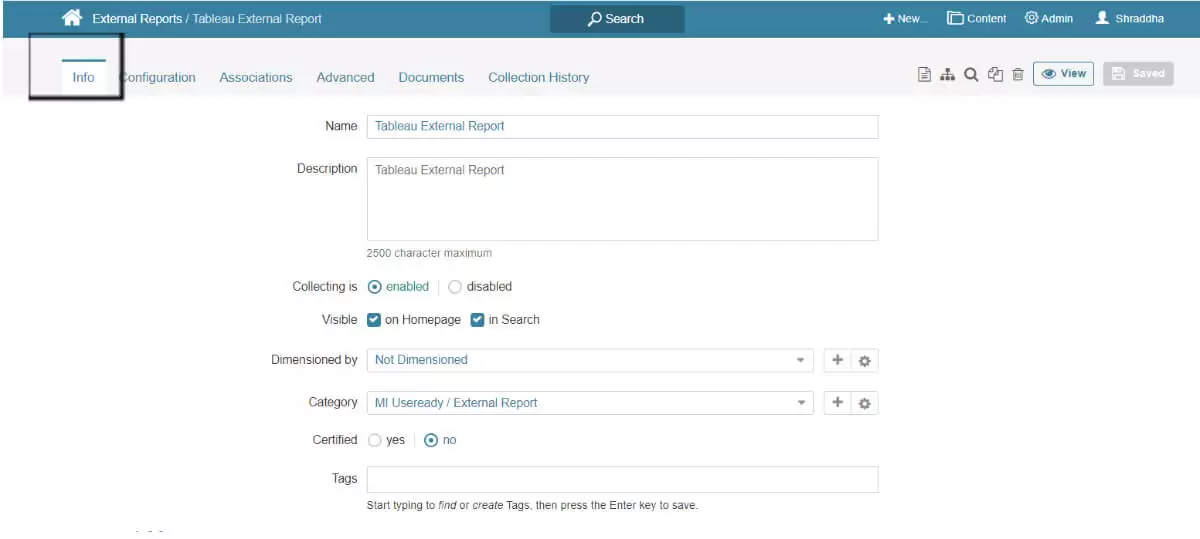
- In “Collecting is” option, new element will be ‘disabled’ until you publish the report
- By default, users can find newly created elements via Search and on the Homepage
- Disabling these check boxes makes the element visible to the Admin and creator only
Configuration Tab
Its contents are based upon the specific BI Tool requirements. Below is an example using Tableau:
External Report Type and Object Selection Sections
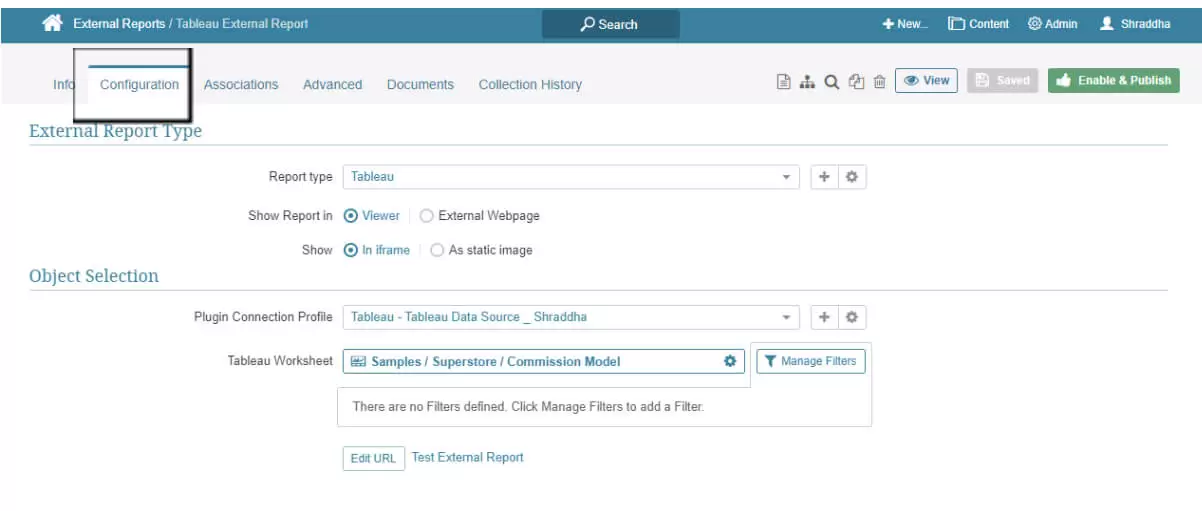
- In Show Report, “External Webpage” means that the Report will be shown on the webpage from which the data was collected.
- If we are choosing “Viewer”, we will get additional options:
- Choose between the iframe and static image
- Select Plugin connection profile (Data source plugin)
- Select proper worksheet
- Manage Filters use to apply Filters to this Report prior to collecting data.
- Select Test URL to confirm that it works properly
Image Collection & Display Sections
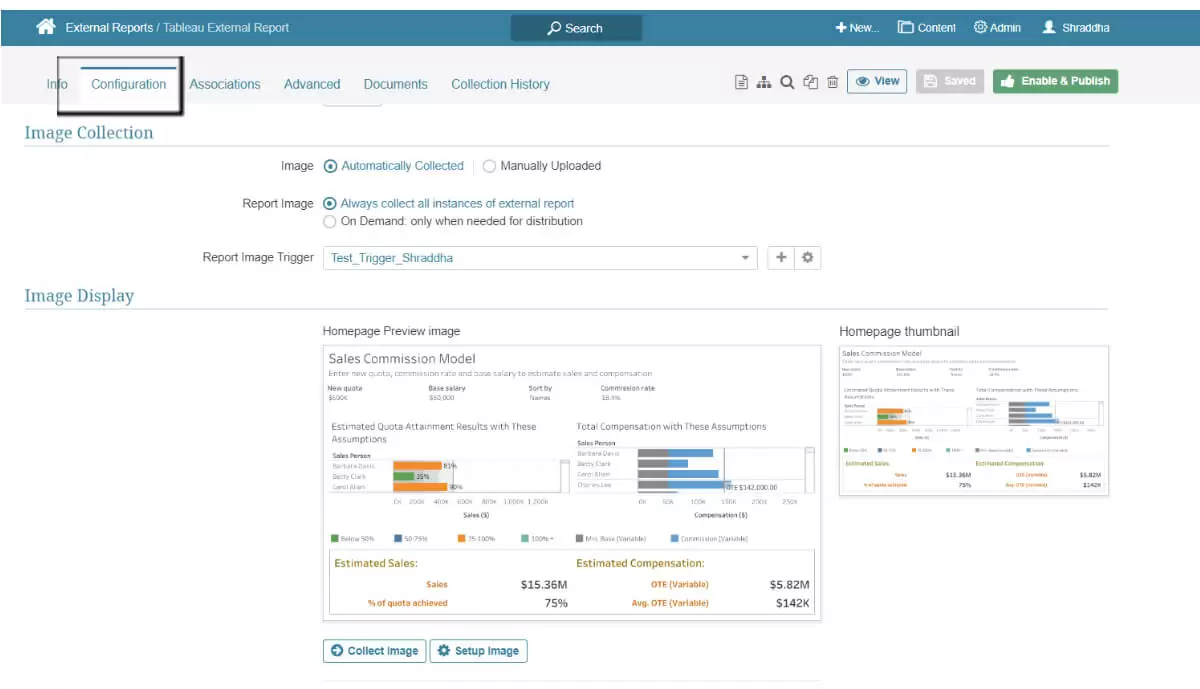
- Image can be “Automatically Collected”, or “Manually Uploaded” by Admin
- Save And Collect Image use to collect the data, set the image and save it
- Setup Image helps to change the Homepage’s preview image height and width.
Advanced Tab
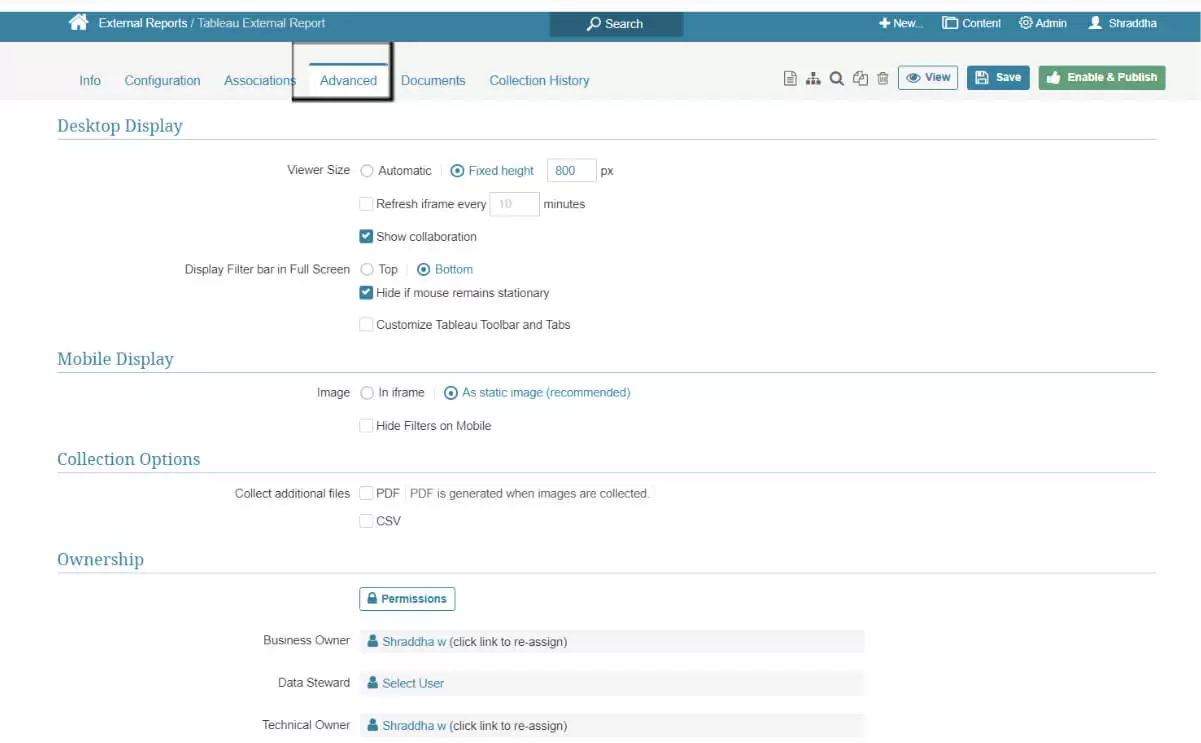
- These options are displayed only if we had selected “Viewer” to display Report.
- Depending on the options selected in External Report Type, the display can differ
- If we select Viewer Size “Automatic” the size of the image will be set automatically according to its original size or size set in the Setup Image.
- It is also possible to set “Fixed height”
- If the “In iframe” was chosen instead of “Static Image” it is possible to set how often it will Refresh
- Show collaboration allow users leave Comments to the Report tile
- Display Filter bar in Full Screen helps to select where to show the filters, on “Top” or “Bottom”
- Select “Static Image”.
- Select suitable Collect additional files options
4) Toolbar Controls

There are five options available in Toolbar Control
- Template used to create a template of the External Report.
- Lineage used to view the Lineage of the Report.
- Search used to search for the data in the Report
- Duplicate used to create a duplicate of this Report
- Delete used to remove the Report
We can go to View option to view and see how the Report will look like.
5) End Result
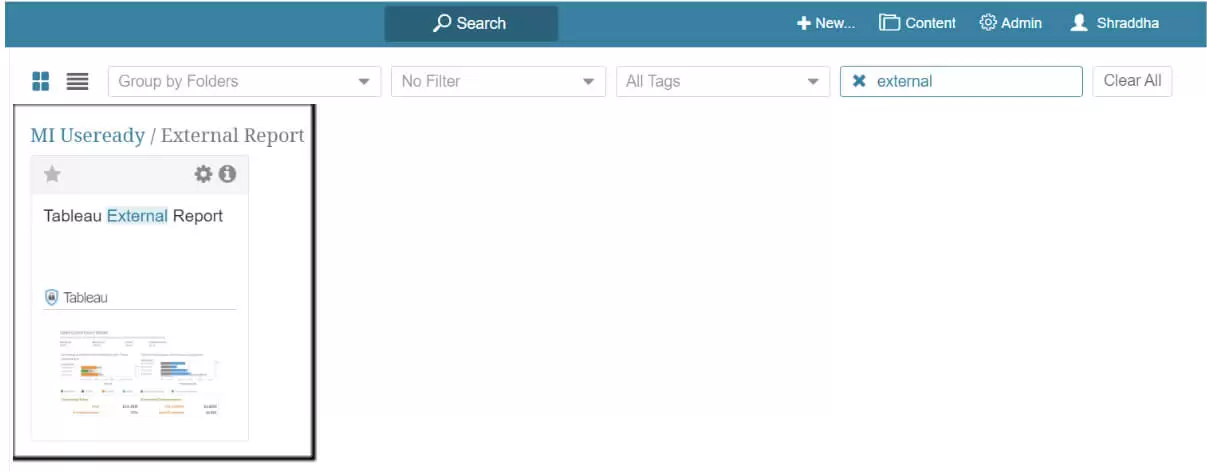
- Once External Reports are created, a user will be able to view & check variety of relevant reports from their personal list of Favourite’s or Categories to which the user has access.
