 Media Coverage
 Press Release
Maximizing Efficiency with Alteryx
Enhance Your Alteryx Investment

As an Alteryx user, have you ever wondered just how effectively your organization is utilizing the capabilities of Alteryx Server? Did you know that the built-in Alteryx Server Usage Reporting workflow can help you not just extract insights like user behavior, content utilization, and performance but also help you optimize the workflows and boost ROI?
Introduction to Alteryx Optimization
Step 1: Streamlining Workflows
Step 2: Enhancing Data Analytics
Step 3: Leveraging Advanced Features
Step 4: Measuring ROI Effectively
Understanding the Basics of Alteryx
Key Workflow Improvements
Advanced Analytics Techniques
ROI Measurement Tools
Let’s take a look at how pre-installed Alteryx Server Usage Reporting workflow can be your secret weapon to supercharge your Alteryx Server setup. Here’s a step-by-step guide for generating a comprehensive Usage Report:
Step 1:
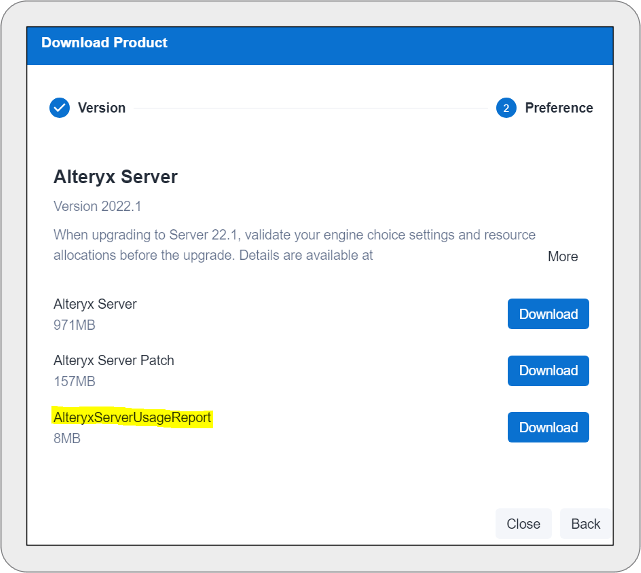
The Alteryx Server Usage Reporting Workflow is available on the licenses.alteryx.com. Once downloaded the zip file on your machine, extract the zip file to get all the associated files with the workflow.
Step 2:
Open the workflow in the Alteryx designer and configure the Alteryx Server Usage Report Macro.
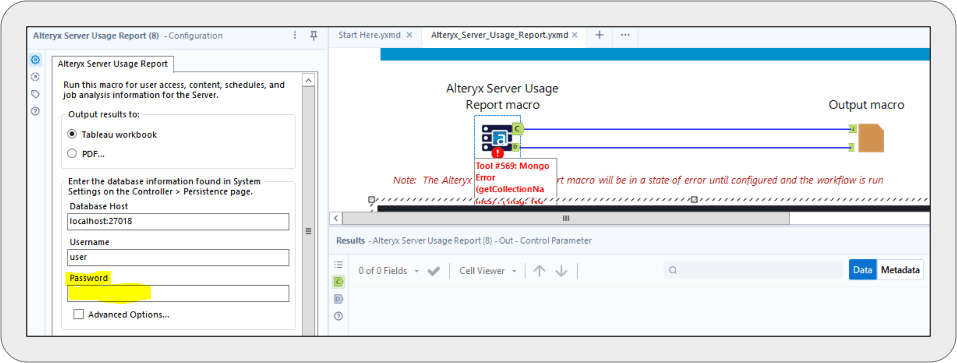
Note:
- If you are running the workflow on the same machine on which the Alteryx Server and MongoDB are installed, then the Database Host will be localhost:27018 else server machine name:27018.
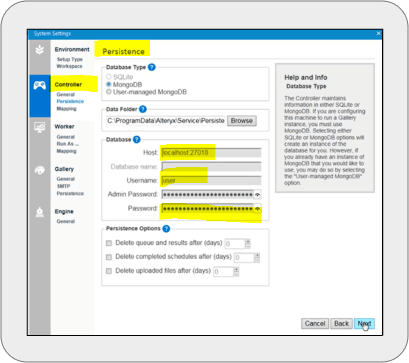
- To get the Password for the Database host, Open Alteryx System Settings.
- Click Next and navigate to the persistence page under the controller.
- Copy the password.
Step 3:
Configure the output macro to get the Tableau workbook to a specified location.
Step 4:
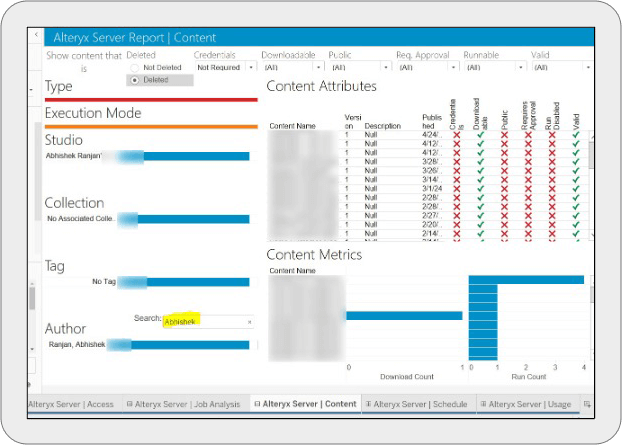
Visualization and Reporting
By configuring the macros of the workflow, we can get the output as a Tableau workbook or a PDF which contains the user access, content, schedules, and Job analysis information for the server.
Here’s a screenshot of the sample Tableau Dashboard:
And there you have it! With Alteryx Server Usage Reporting workflow and a few clicks, you can get a thorough look at your server’s activity. This information will enable you to make informed decisions about where resources should be allocated, pinpoint training requirements, and ensure that you and your organization are maximizing their Alteryx investment.
Click Here to read about Data Value