Understanding ALL and ALLSELECTED Functions in Power BI
Power BI Data Filtering: ALL vs. ALLSELECTED Explained
Mastering Power BI Filtering with ALL and ALLSELECTED
Introduction to ALL and ALLSELECTED in Power BI
Key Differences Between ALL and ALLSELECTED
Use Cases for ALL and ALLSELECTED Functions
Enhancing Data Insights with Smarter Filtering
Why Use ALL in Power BI?
Benefits of ALLSELECTED for Dynamic Filtering
Practical Examples of ALL vs ALLSELECTED
Tips for Choosing the Right Function
Power BI is a powerful tool for data analysis and visualization, but to unlock its full potential, it’s crucial to understand how to use its functions effectively. Two functions that often confuse users are ALL and ALLSELECTED. Although they seem similar at first – since both are used to filter and manipulate data – each serves a unique purpose and behaves differently based on context. In this brief guide we will clarify the differences between ALL and ALLSELECTED, helping you choose the right one for your data analysis needs.
ALL Function
The ALL function removes any filters from a table or column in a data model. When applied, it returns all rows from the specified table or column, ignoring any filters or slicers in the report.
Use Case
- Global Aggregations: Useful when you need metrics unaffected by slicers or visuals.
- Comparisons: Ideal for creating measures that compare filtered data to the total dataset.
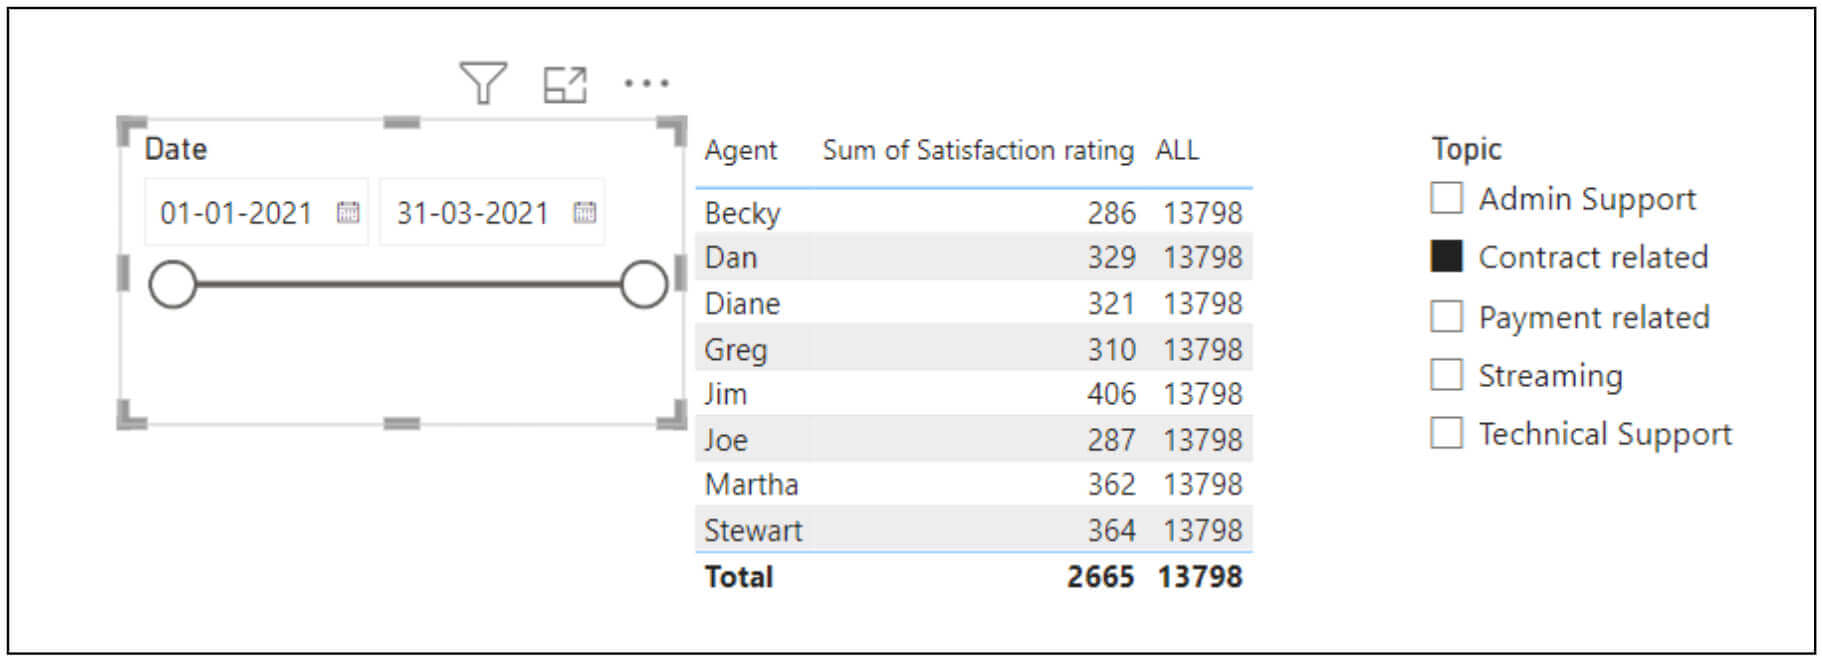
Example: If you have a report and you want to calculate the satisfaction rating irrespective of any filters applied (like date or topic), use:

DAX
ALL = CALCULATE(SUM(Data[Satisfaction rating]), ALL(Data))
Here, ALL(Data) removes any filters on the Data table, giving you the satisfaction rating for the entire dataset.
ALLSELECTED Function
Conversely, ALLSELECTED removes only the visual filter context while retaining slicer and filter context. It is often used for values dependent on slicer selections but independent of visual-level filters in a report.
Use Cases
- Slicer-Based Calculations: For calculations that respect slicer selections but ignore direct visual filters.
- Dynamic Measures: For measures that adapt to user-selected data ranges, keeping certain slicers or filters in place.
Example: Calculating satisfaction ratio based on slicer selections while ignoring visual-level filters, use:

DAX:
ALLSELECTED = CALCULATE(SUM(Data[Satisfaction rating]), ALLSELECTED(Data))
Here, ALLSELECTED(Data) respects slicer selections but disregards visual filters.
Key Differences Between ALL and ALLSELECT
- Filter Removal: ALL removes both slicer and visual filters, while ALLSELECTED removes only visual filters, retaining slicer selections.
- Context: ALL is ideal for calculating values across an entire dataset, whereas ALLSELECTED is suited for slicer-dependent calculations.
- Typical Scenarios: Use ALL for global metrics and comparisons; use ALLSELECTED when slicer context is necessary.
Practical Example and Comparison
Imagine a report that has a data table and two filters: a topic and a date filter to show the differences.
- With ALL: Applying ALL(Data) ignores both the date and topic filters, resulting in a global total unaffected by either filter.
- With ALLSELECTED: Using ALLSELECTED(Data) respects both date and topic filters, reflecting only the data filtered by those selections.
Conclusion
Mastering the differences between ALL and ALLSELECTED can elevate your data analysis skills in Power BI. Understanding when to use each function allows you to create reports that accurately reflect either broad, overarching insights or nuanced analyses based on user selections. Your ability to choose the right function—ALL for those big-picture aggregations or ALLSELECTED for more dynamic, slicer-respecting measures—will allow you to craft reports that truly speak to your audience.
But don’t just take my word for it—experiment with these functions in your own reports. See firsthand how they influence your data, and how a deeper understanding of their distinctions can help you uncover insights that might otherwise be overlooked. With practice, you’ll find yourself creating more precise, insightful reports that not only present data but also tell a compelling story.


 Media Coverage
 Press Release
