Exploring Pane Totals in Tableau: 5 Different Methods
Mastering Data Analysis: Adding Pane Totals in Tableau
Enhancing Tableau Visualizations: Five Methods for Adding Pane Totals
When we build visualizations on Tableau or other tools, many of us need some kind of total for validation. It can be a total for the entire visualization or total for each of the individual segments. This is very common in crosstabs and also widely requested by end users.
Whether a stacked bar, pie chart, line chart, or bar graph – when we build visualizations on Tableau or other tools, many of us need some kind of total for validation.
5 Different Ways to Add Pane Totals in Tableau
Here, we shall be discussing how to add Pane Totals on a bar chart in 5 different ways.
To understand what a pane is, we have to understand the concept of Tableau visualization.
When visualizations are built on Tableau, we start with a Measure (which gets aggregated) either on Columns or Rows and then use a Dimension (to slice/dice) on Rows or Columns. At this point, the entire visualization is called a Table. If another Dimension is introduced onto Columns or Rows, the entire view is again sliced into pieces, changing the column total and row grand total respectively.
So, every segment is considered a Pane. In simple terms, Panes are Partitions of the visualization created by the two innermost Dimensions.
This is very easy to understand as a Hierarchy (*Not restricted to a Hierarchy).
For example, we have a field called “Employee” having 5 employees A, B, C, D, E and we have a field called “Manager” having 2 managers M1 and M2.
Employees A and B report to M1 and C, D and E report to M2. If the Employee field is used on the Rows shelf, we have 5 total row(s). Progressively, the Manager Field is introduced on Rows shelf to the left of Employee field, creating partitions – this partition is called a Pane, Scope, Branch, or Segment.
Understanding Pane Totals: Importance and Application in Tableau
Exploring the Benefits of Adding Pane Totals in Tableau Visualizations
Step-by-Step Tutorial: Implementing Different Methods to Add Pane Totals in Tableau
Leveraging Tableau’s Advanced Features: Tips and Tricks for Pane Total Visualization
Best Practices: Optimizing Tableau Visualizations with Pane Total Techniques
Cells make up a Pane. Panes make up a Table.

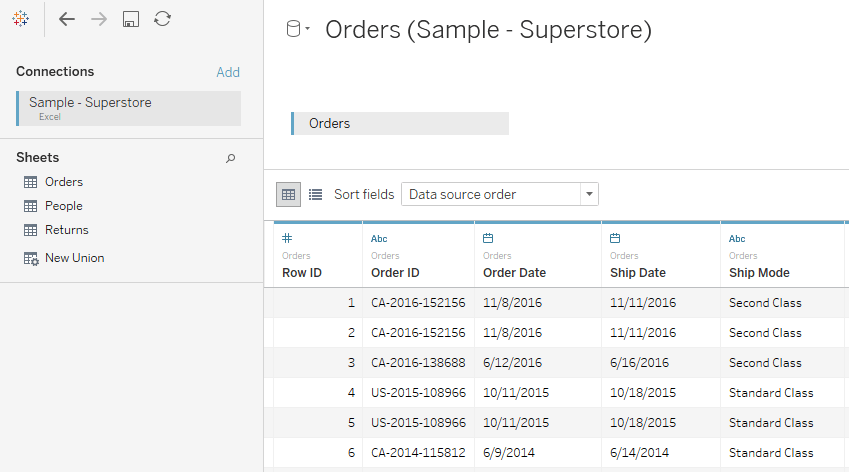
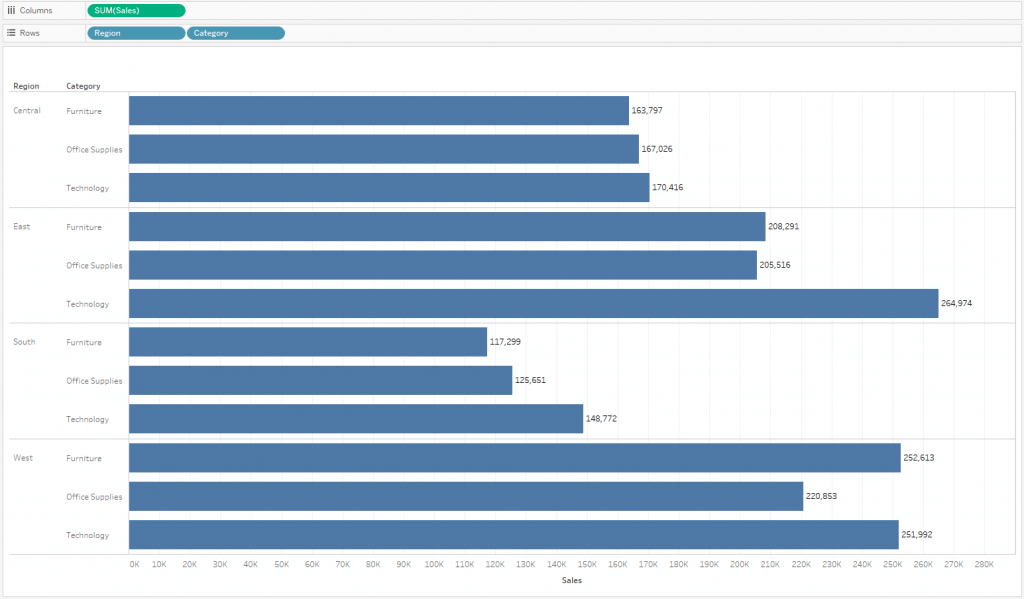
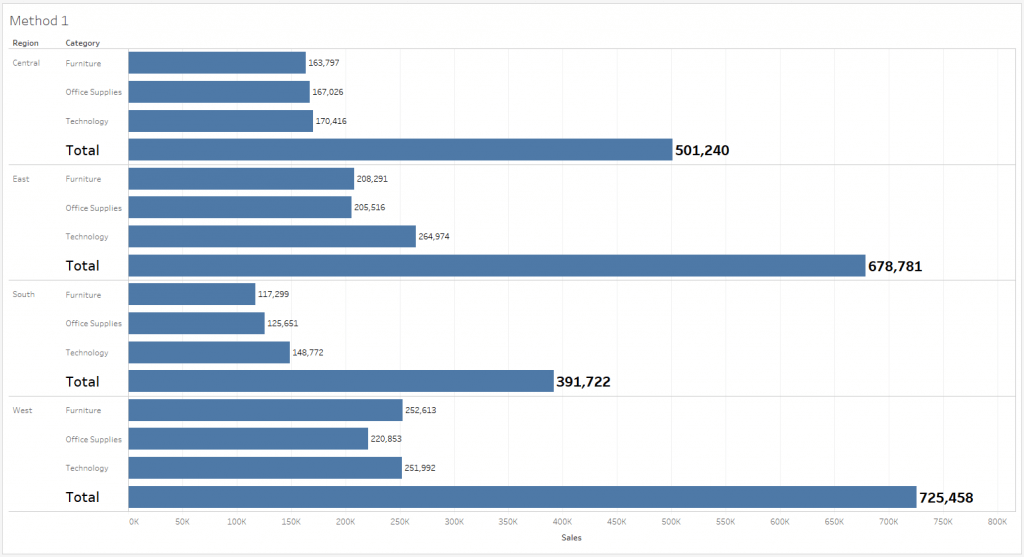
For demonstration purposes, we shall be using the Sample – Superstore dataset with the Orders table. We are building a very simple bar chart with Region and Category for Sales as SUM aggregation with labels.
Method 1 – Add Pane Totals in Tableau
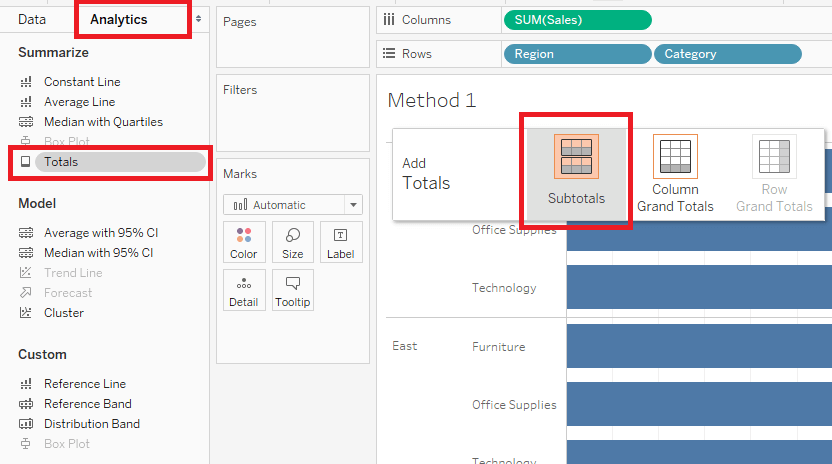
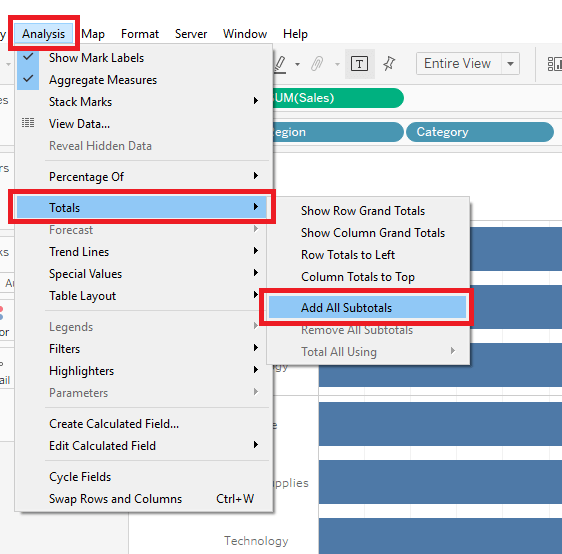
This method to add totals is very straight forward and easy. We begin by using the Total from the Analytics pane for “Subtotals” (Scope or Partition) or using the option called “Add all Subtotals” made available from within the Analysis menu.
Method 2 – Add Pane Totals in Tableau
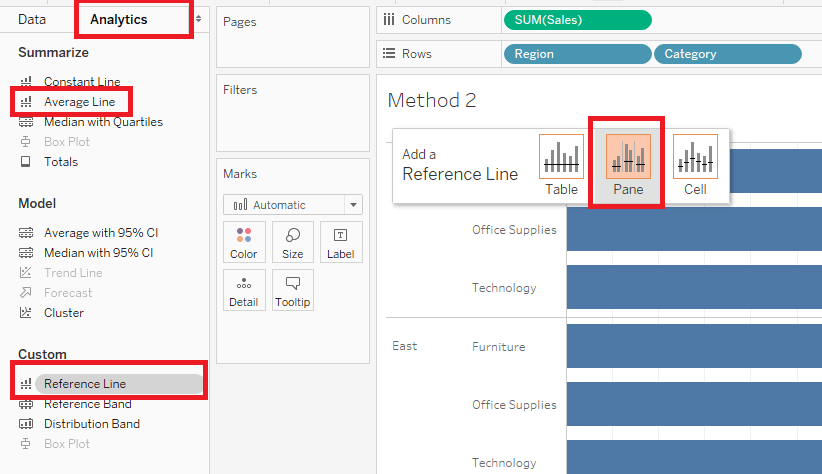
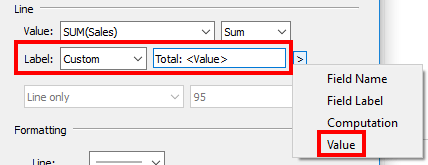
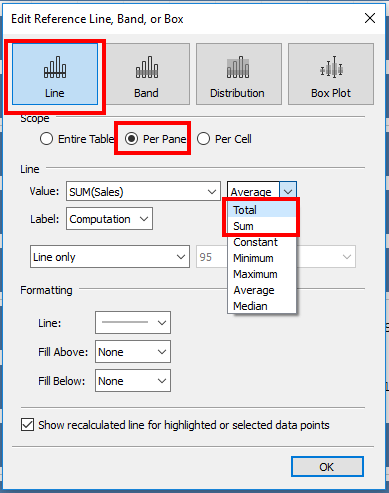
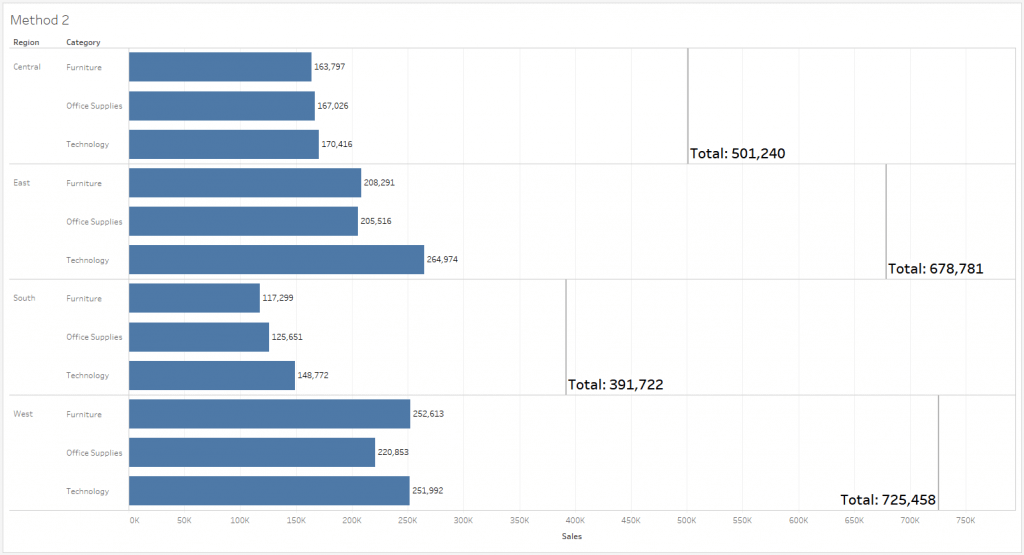
Again a very simple approach. Using the Reference Line from the Analytics pane for every Pane (Scope or Partition) as Sum or Total aggregation with a customized label.
In this case, the SUM is actually the Window_SUM() which is computed locally on the view including the duplicates Total() function will be computed on the data directly at the source excluding all duplicates.
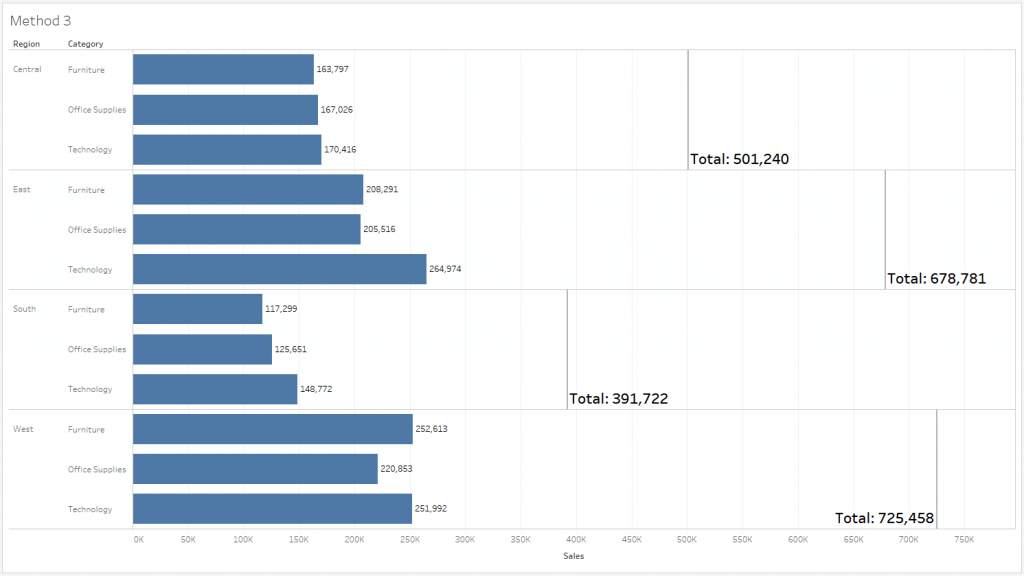
Method 3 – Add Pane Totals in Tableau
As discussed in the previous method to add totals,
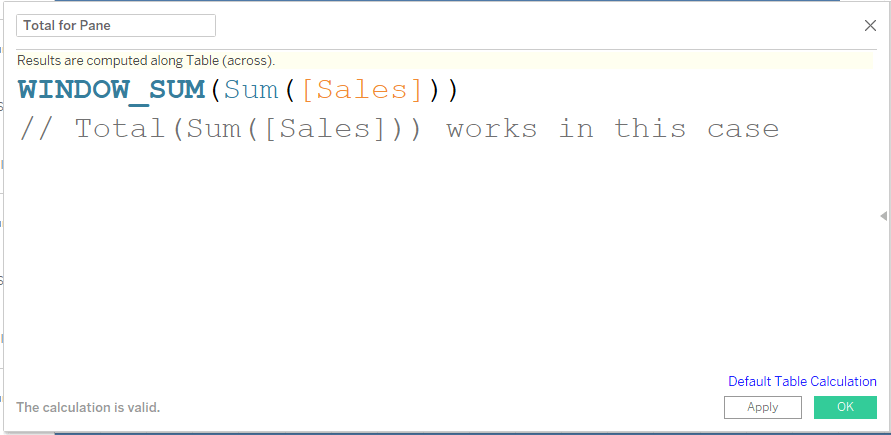
a) Creating a Window Calculation for the existing measure called “Total for Pane”. Window_Sum(Sum(Sales))
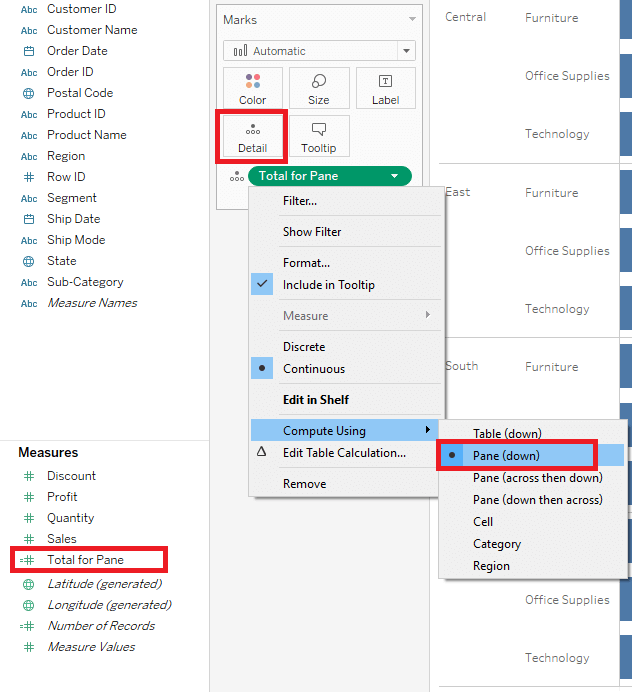
b) Use the new calculation “Total for Pane” on Detail card and Compute Using every Pane
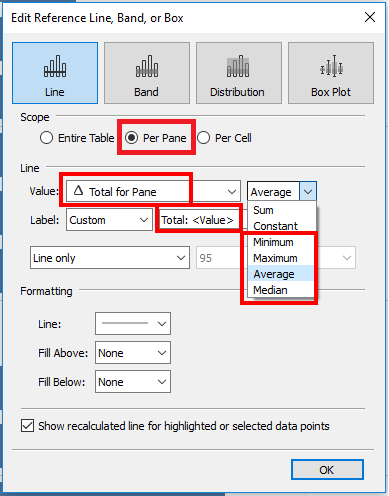
c) Add a Reference Line for every Pane using the “Total for pane” and customize the label
(In this case, Minimum, Maximum, Average, and Median all work the same)
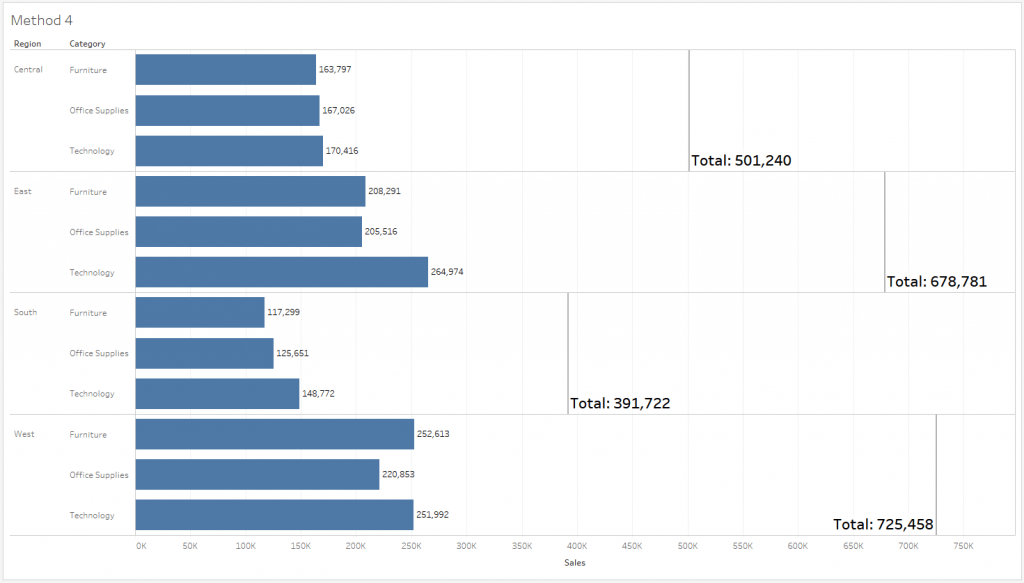
Method 4 – Add Pane Totals in Tableau
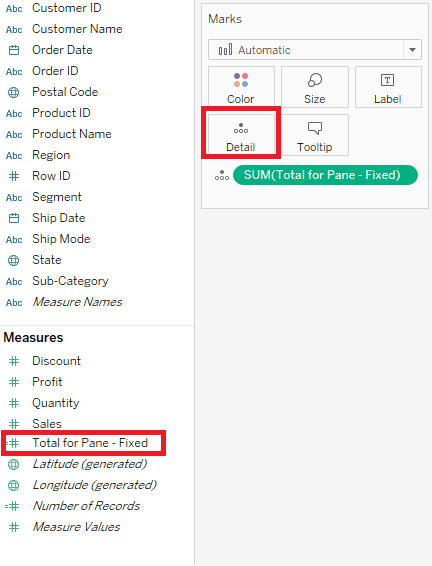
a) Creating a Fixed LOD Calculation for the existing measure called “Total for Pane – Fixed”.
{ Fixed [Region] : Sum(Sales) }
b) Use the new calculation “Total for Pane – Fixed” on the Detail card.
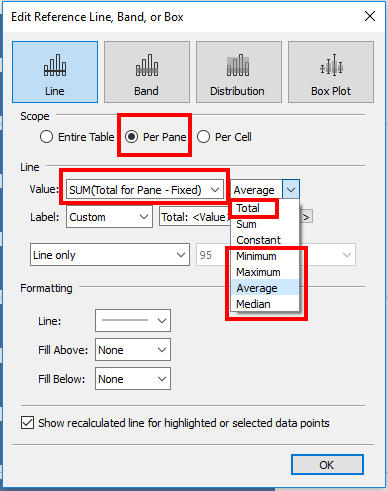
c) Add a Reference Line for every Pane using the “Total for Pane – Fixed” and customize the label
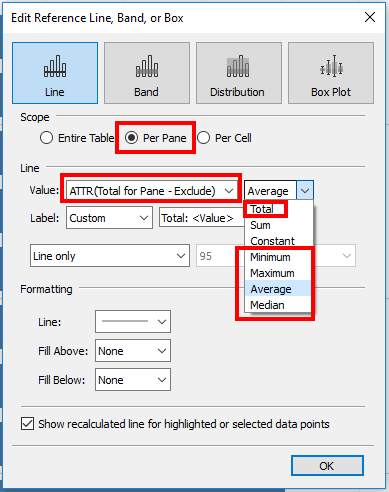
(In this case, Total, Minimum, Maximum, Average, and Median all work the same)

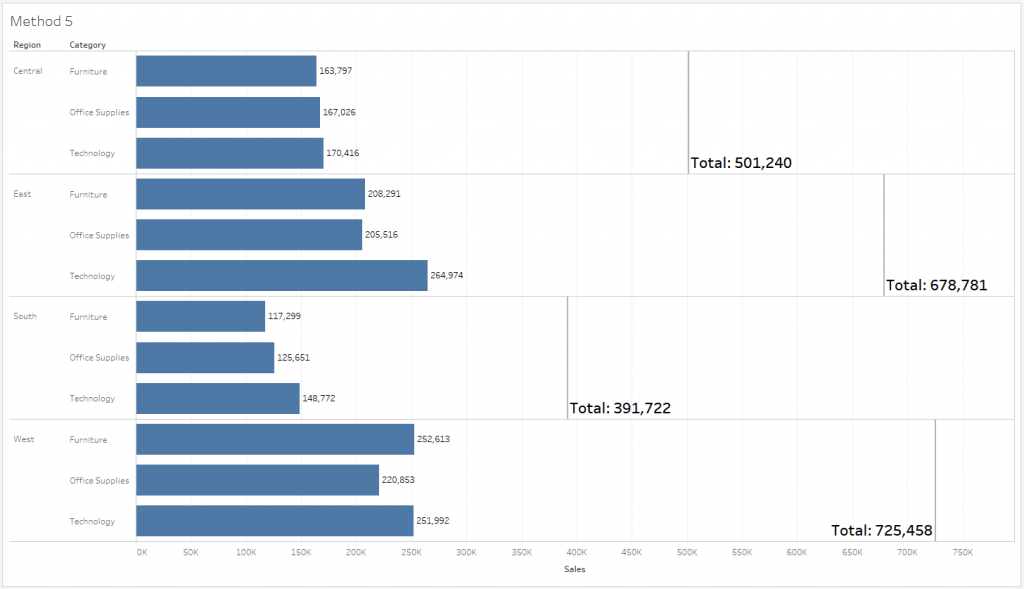
Method 5 – Add Pane Totals in Tableau
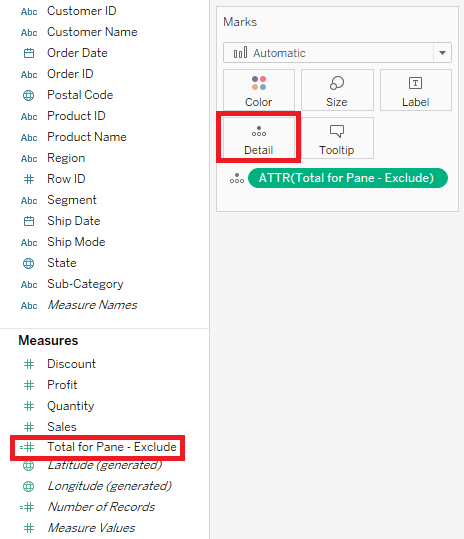
a) Creating an Exclude LOD Calculation for the existing measure called “Total for Pane – Exclude”.
{ Exclude [Category] : Sum(Sales) }
b) Use the new calculation “Total for Pane – Exclude” on the Detail card.
c) Add a Reference Line for every Pane using the “Total for Pane – Exclude” and customize the label



 Media Coverage
 Press Release
