Implementing Zoom In and Out in Tableau: A Comprehensive Guide
Enhancing Tableau Visualizations with Zoom Capabilities
Step-by-Step Guide to Adding Zoom in Tableau
Make Data Exploration Easier with Zoom in Tableau
Benefits of Zoom Functionality in Tableau Dashboards
Stepwise Instructions for Adding Zoom in Tableau
Enhancing Data Interaction with Zoom in Tableau
Practical Applications of Zoom Features in Data Visualization
Setting Up Zoom Controls in Tableau
Customizing Zoom Options for Better User Experience
Testing and Refining the Zoom Feature
Troubleshooting Common Zoom Feature Issues
One of the main challenges in building dashboards is showing the right amount of detail while keeping the view insightful and not overwhelming for users. Different business users often need varying levels of detail when viewing the same dashboard. Due to limited dashboard space, adding extra detail to charts isn’t always possible.
But what if you could make a chart occupy more dashboard space with a button click and revert it with another click? With the extra space, you can easily add additional detail on demand without overwhelming users.
In this blog, we’ll explore a simple and clean way to build a Zoom In/Out functionality for your dashboard views.
Step 1
Add a Show/Hide Button
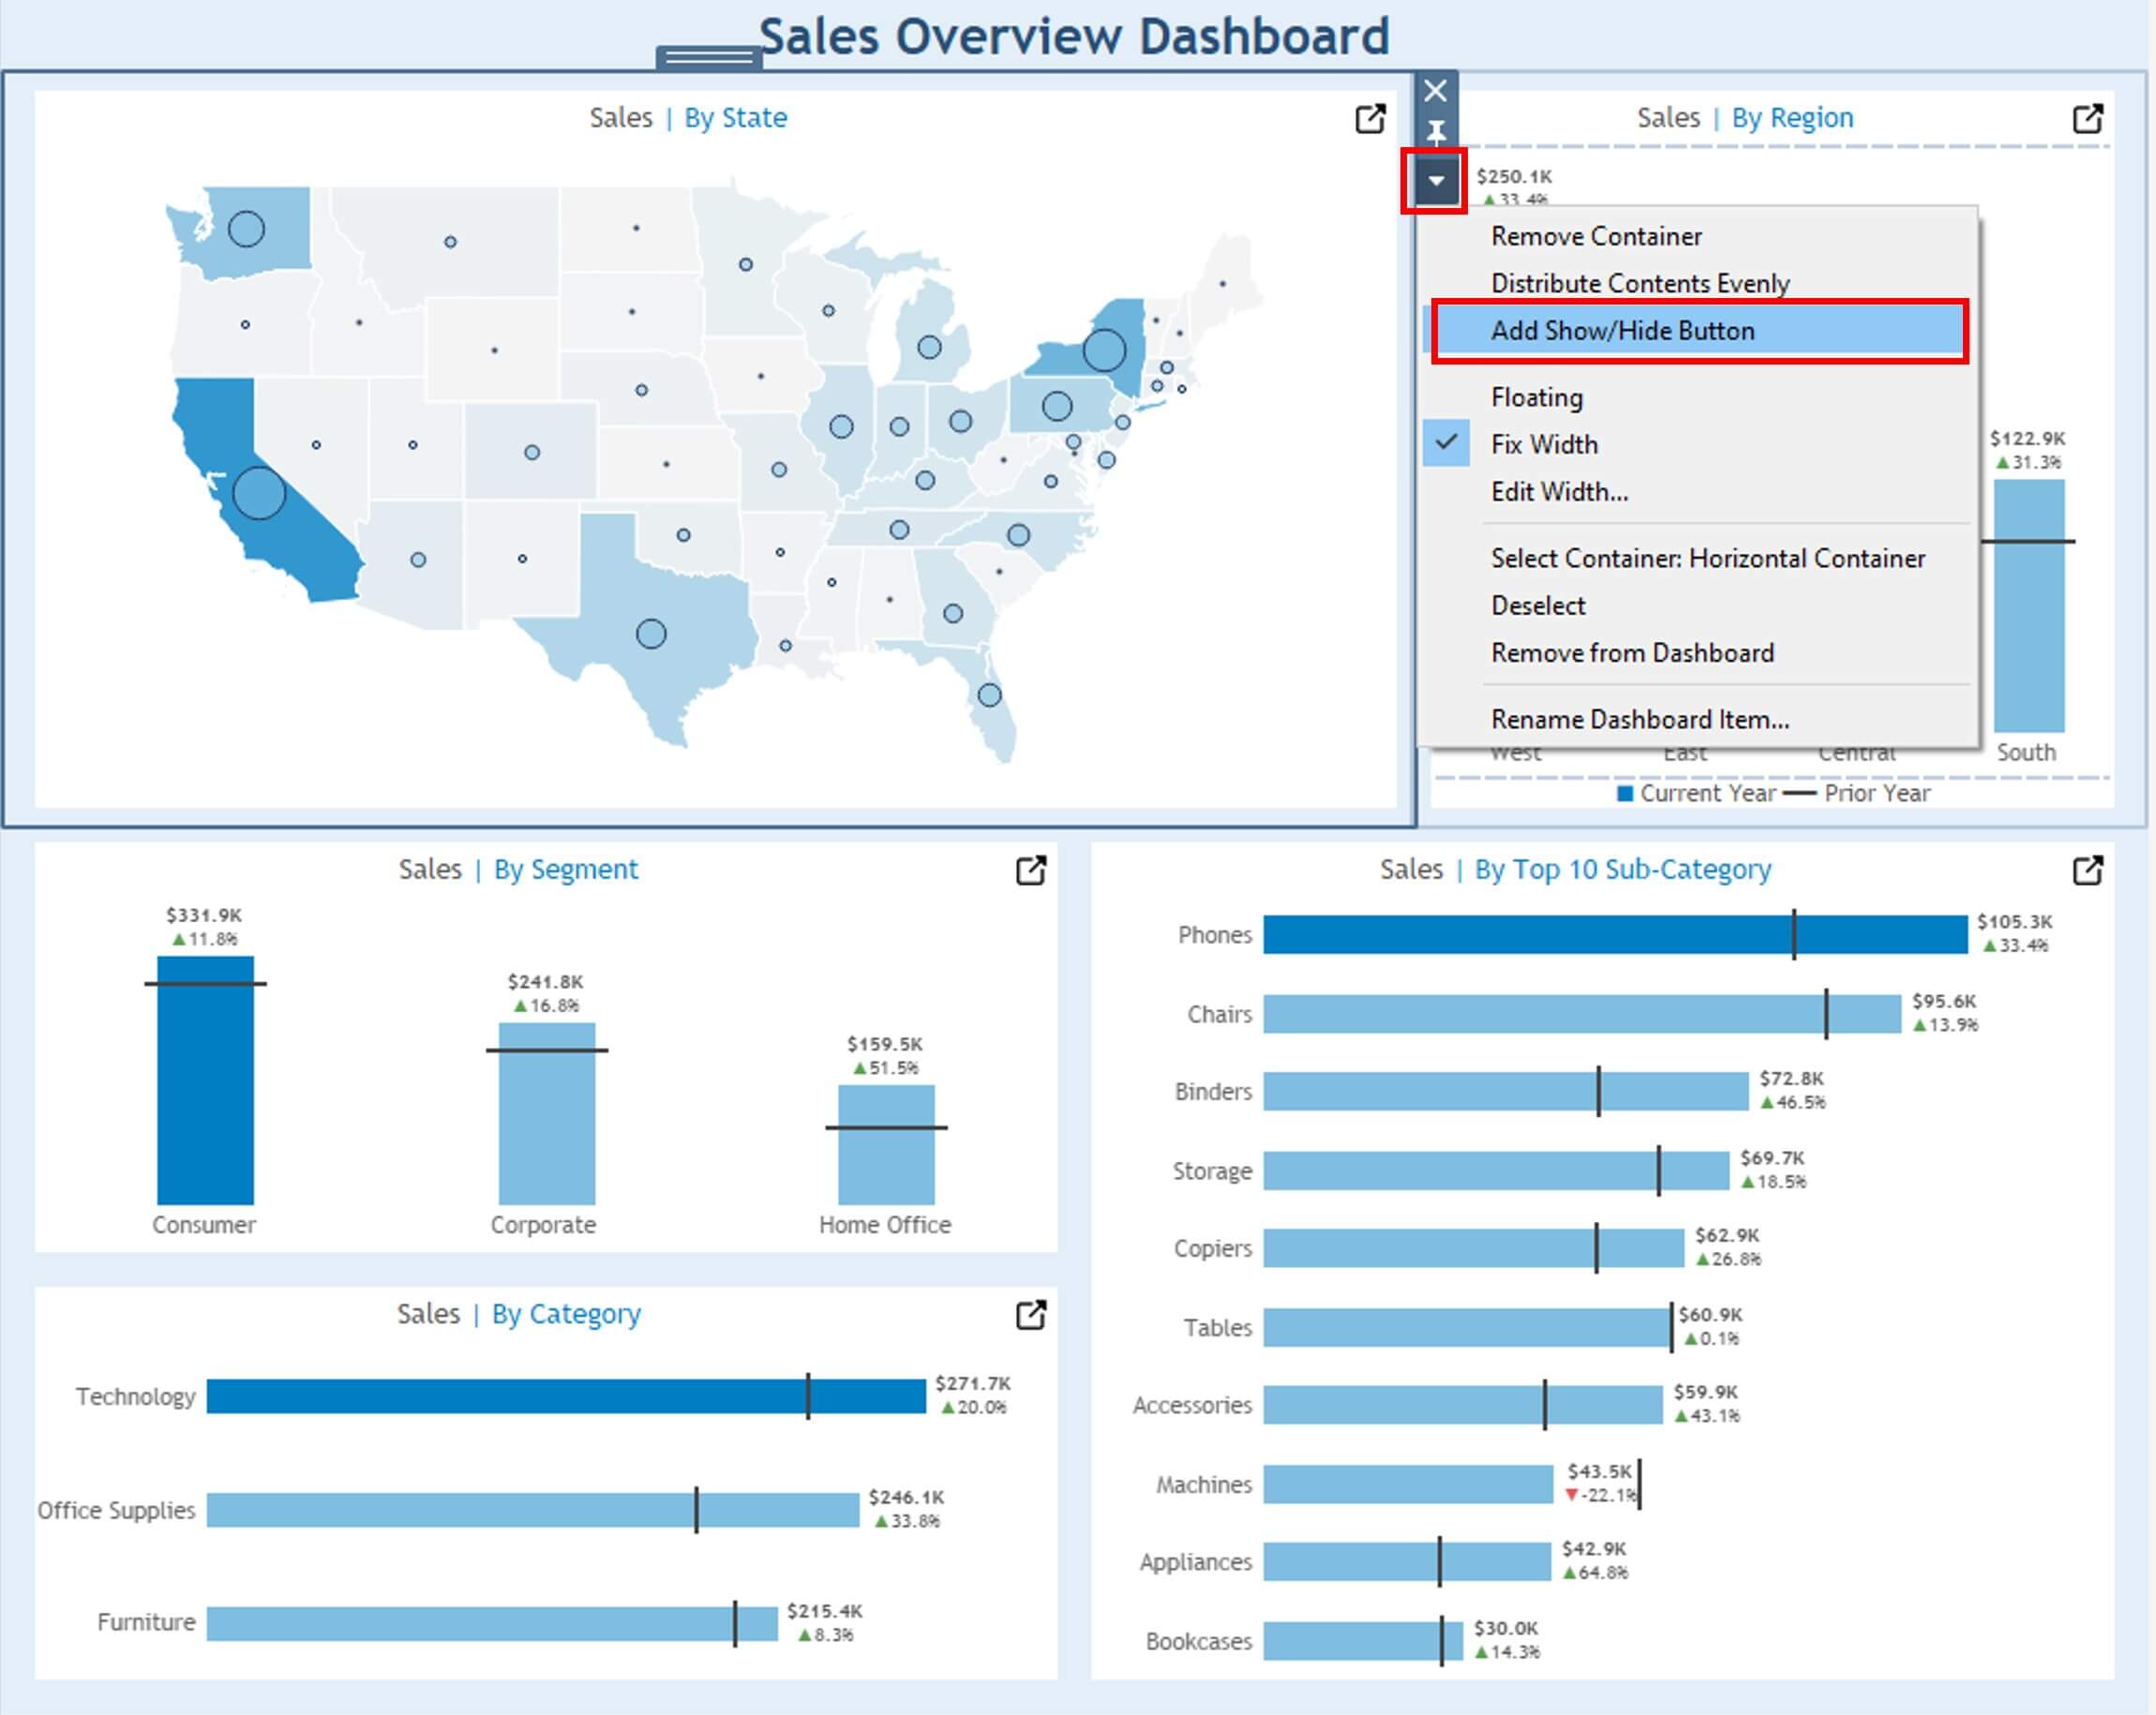
Right-click on the container or worksheet you want to zoom in on and select “Add Show/Hide Button”. For example, in the Sales Overview Dashboard below, we want to zoom in on the “Sales / By State” chart. So, we added a Show/Hide Button for it.

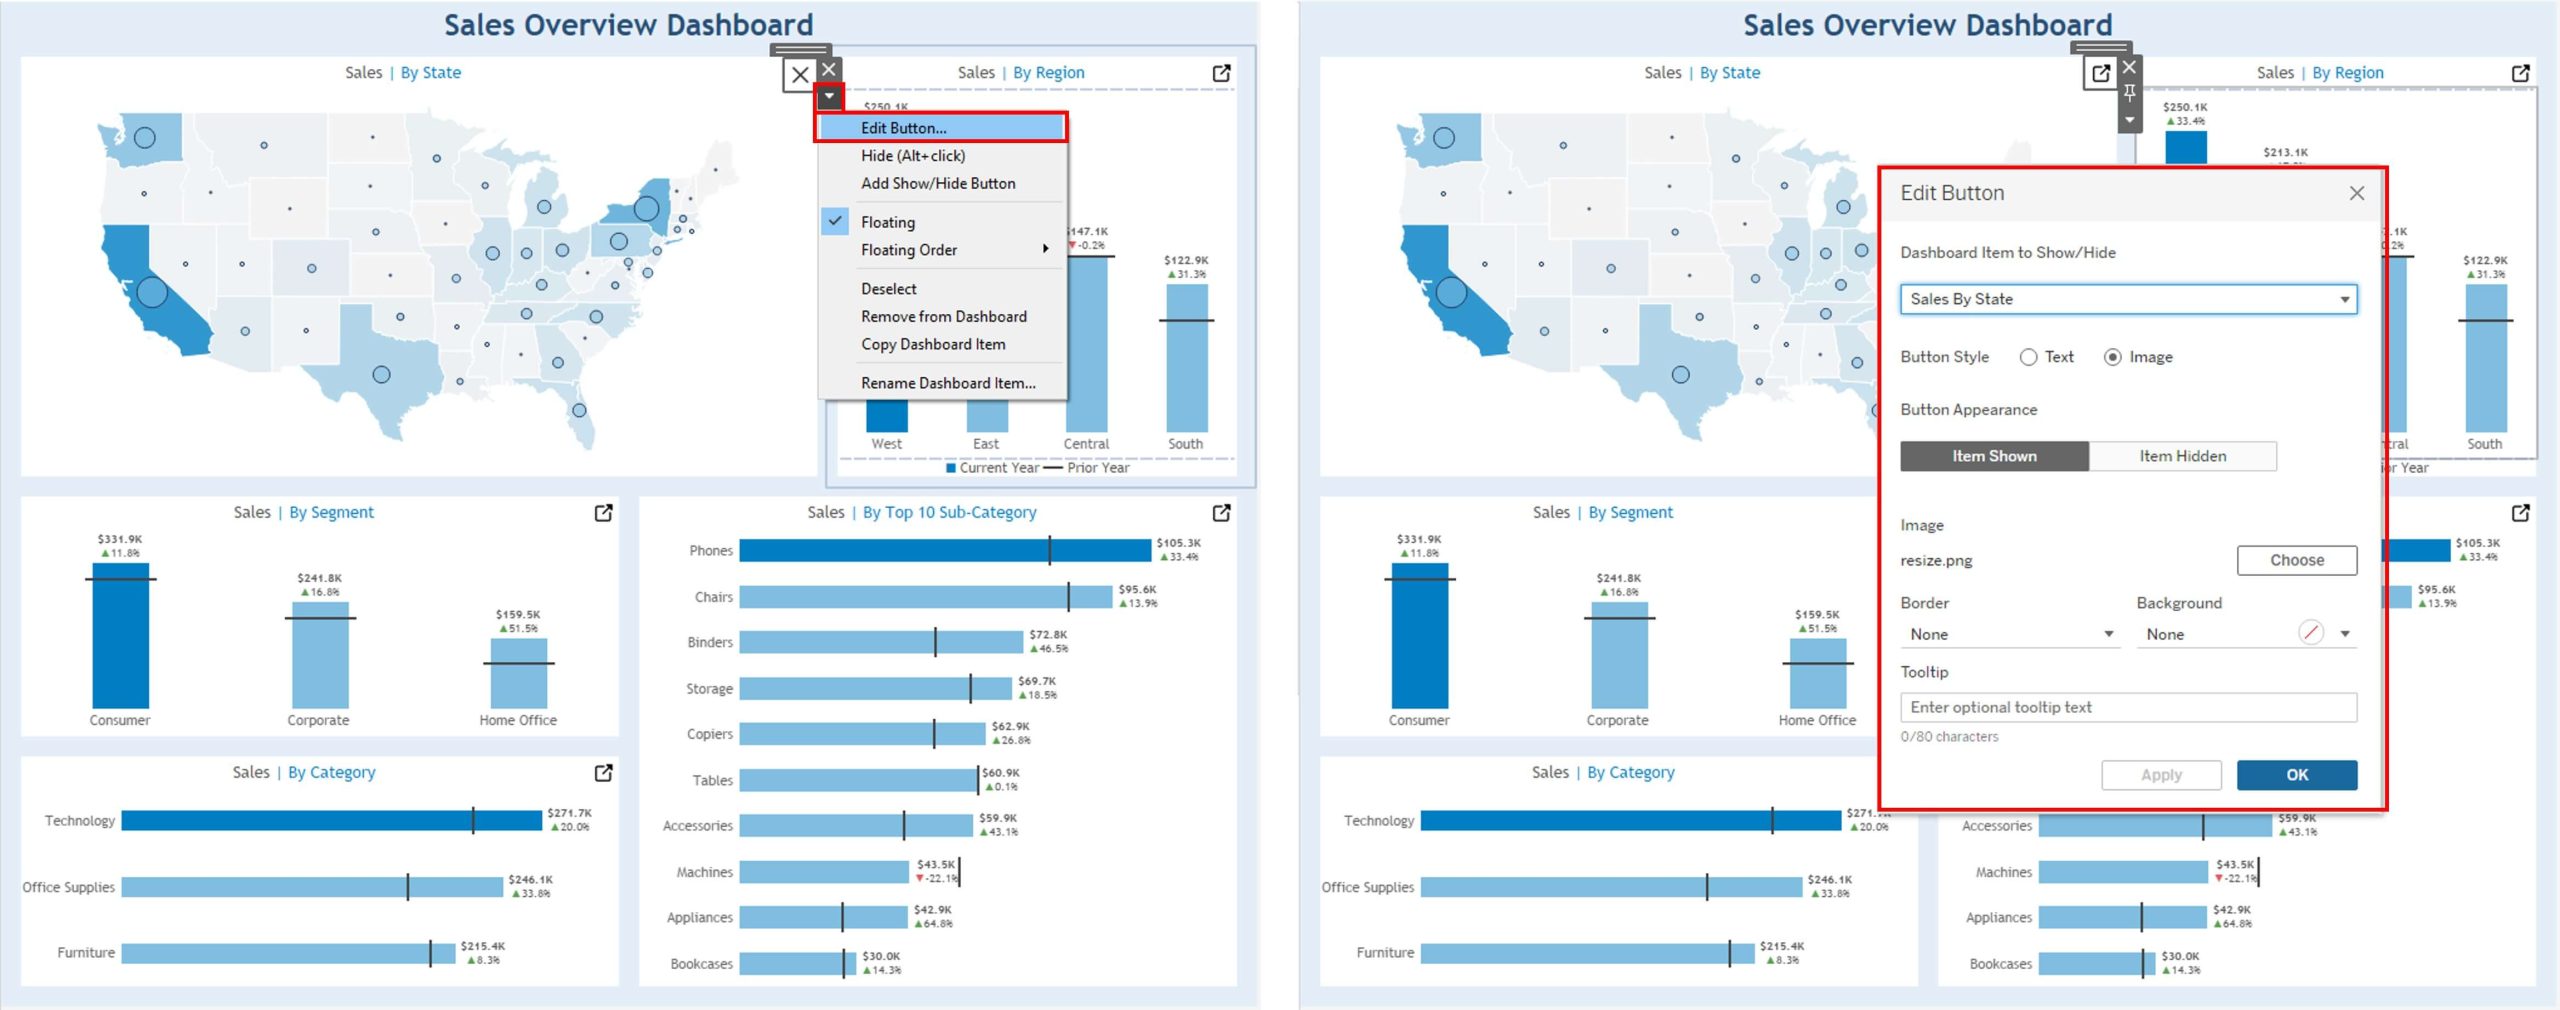
Adjust the size and position of this button appropriately. You can edit this button and change its style, appearance, etc., using the formatting options as shown in the picture below.

Step 2
Rename Containers
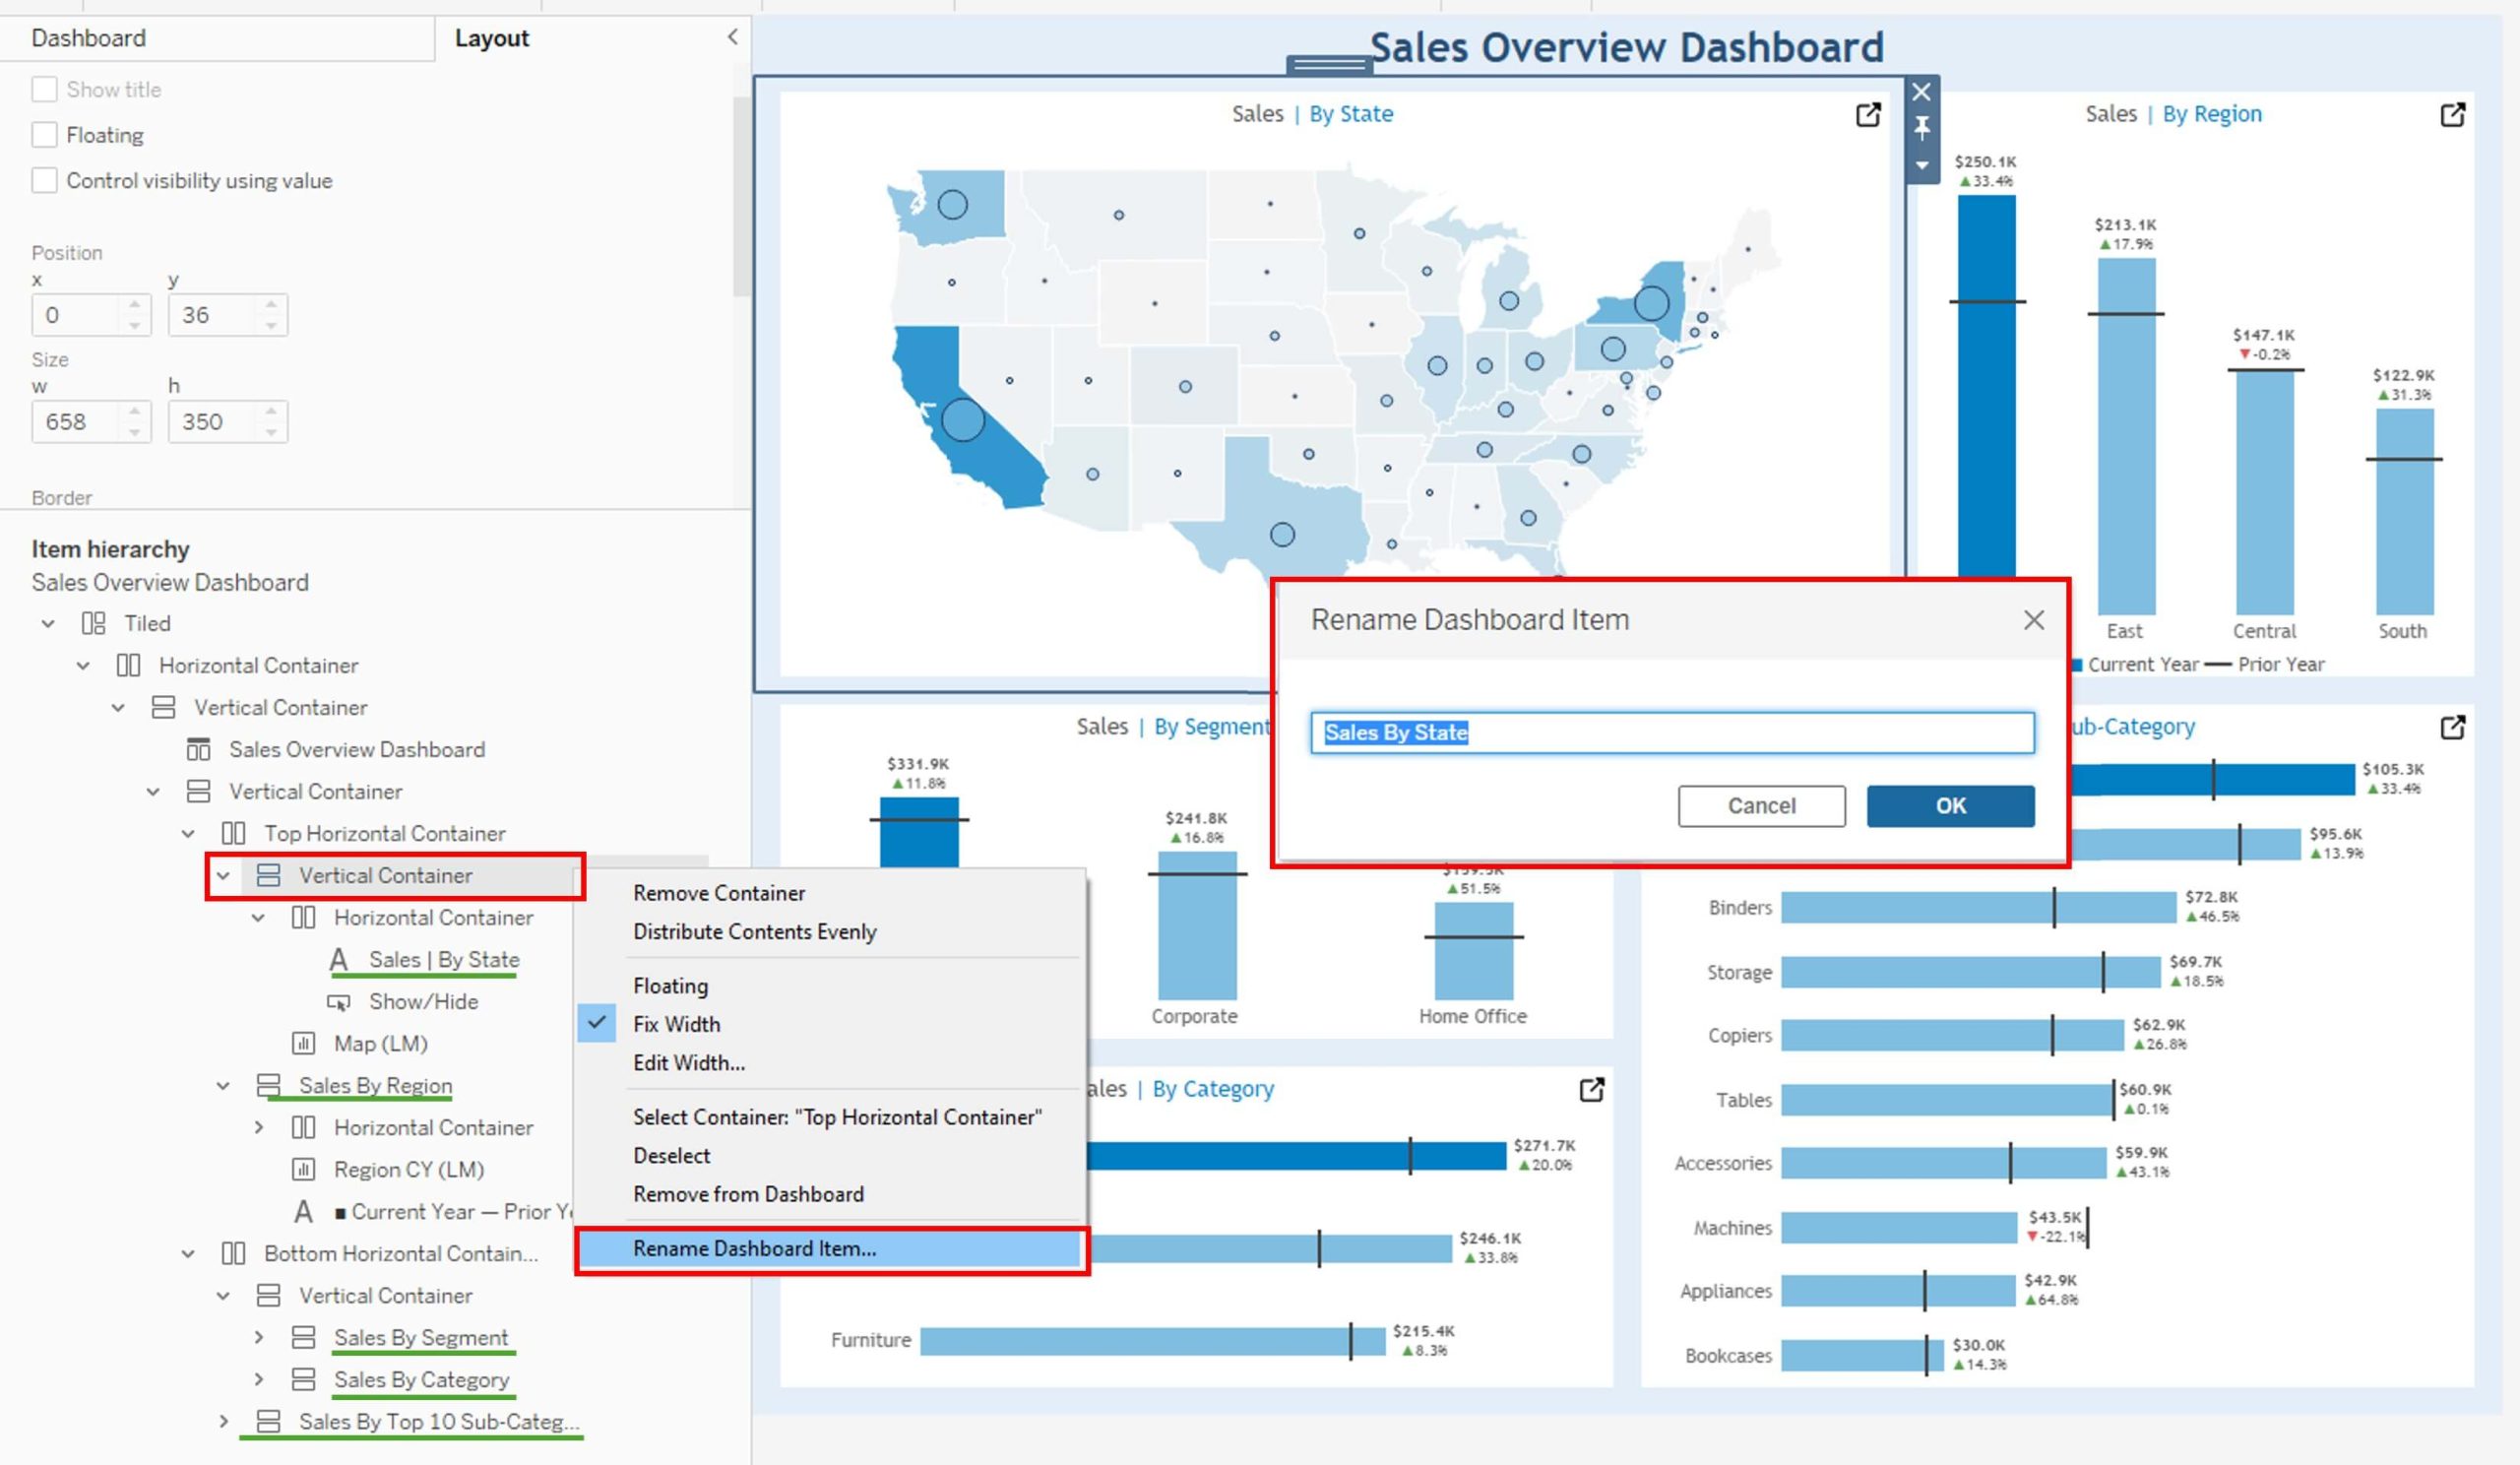
Rename all the containers or sheets with appropriate names. In this example, we have renamed all the containers in the dashboard with suitable names to identify them during further steps.

Step 3
Save as .twb
Save the file in .twb format and open it in Notepad++.
Step 4
Add Zone IDs in Show/Hide Button Script
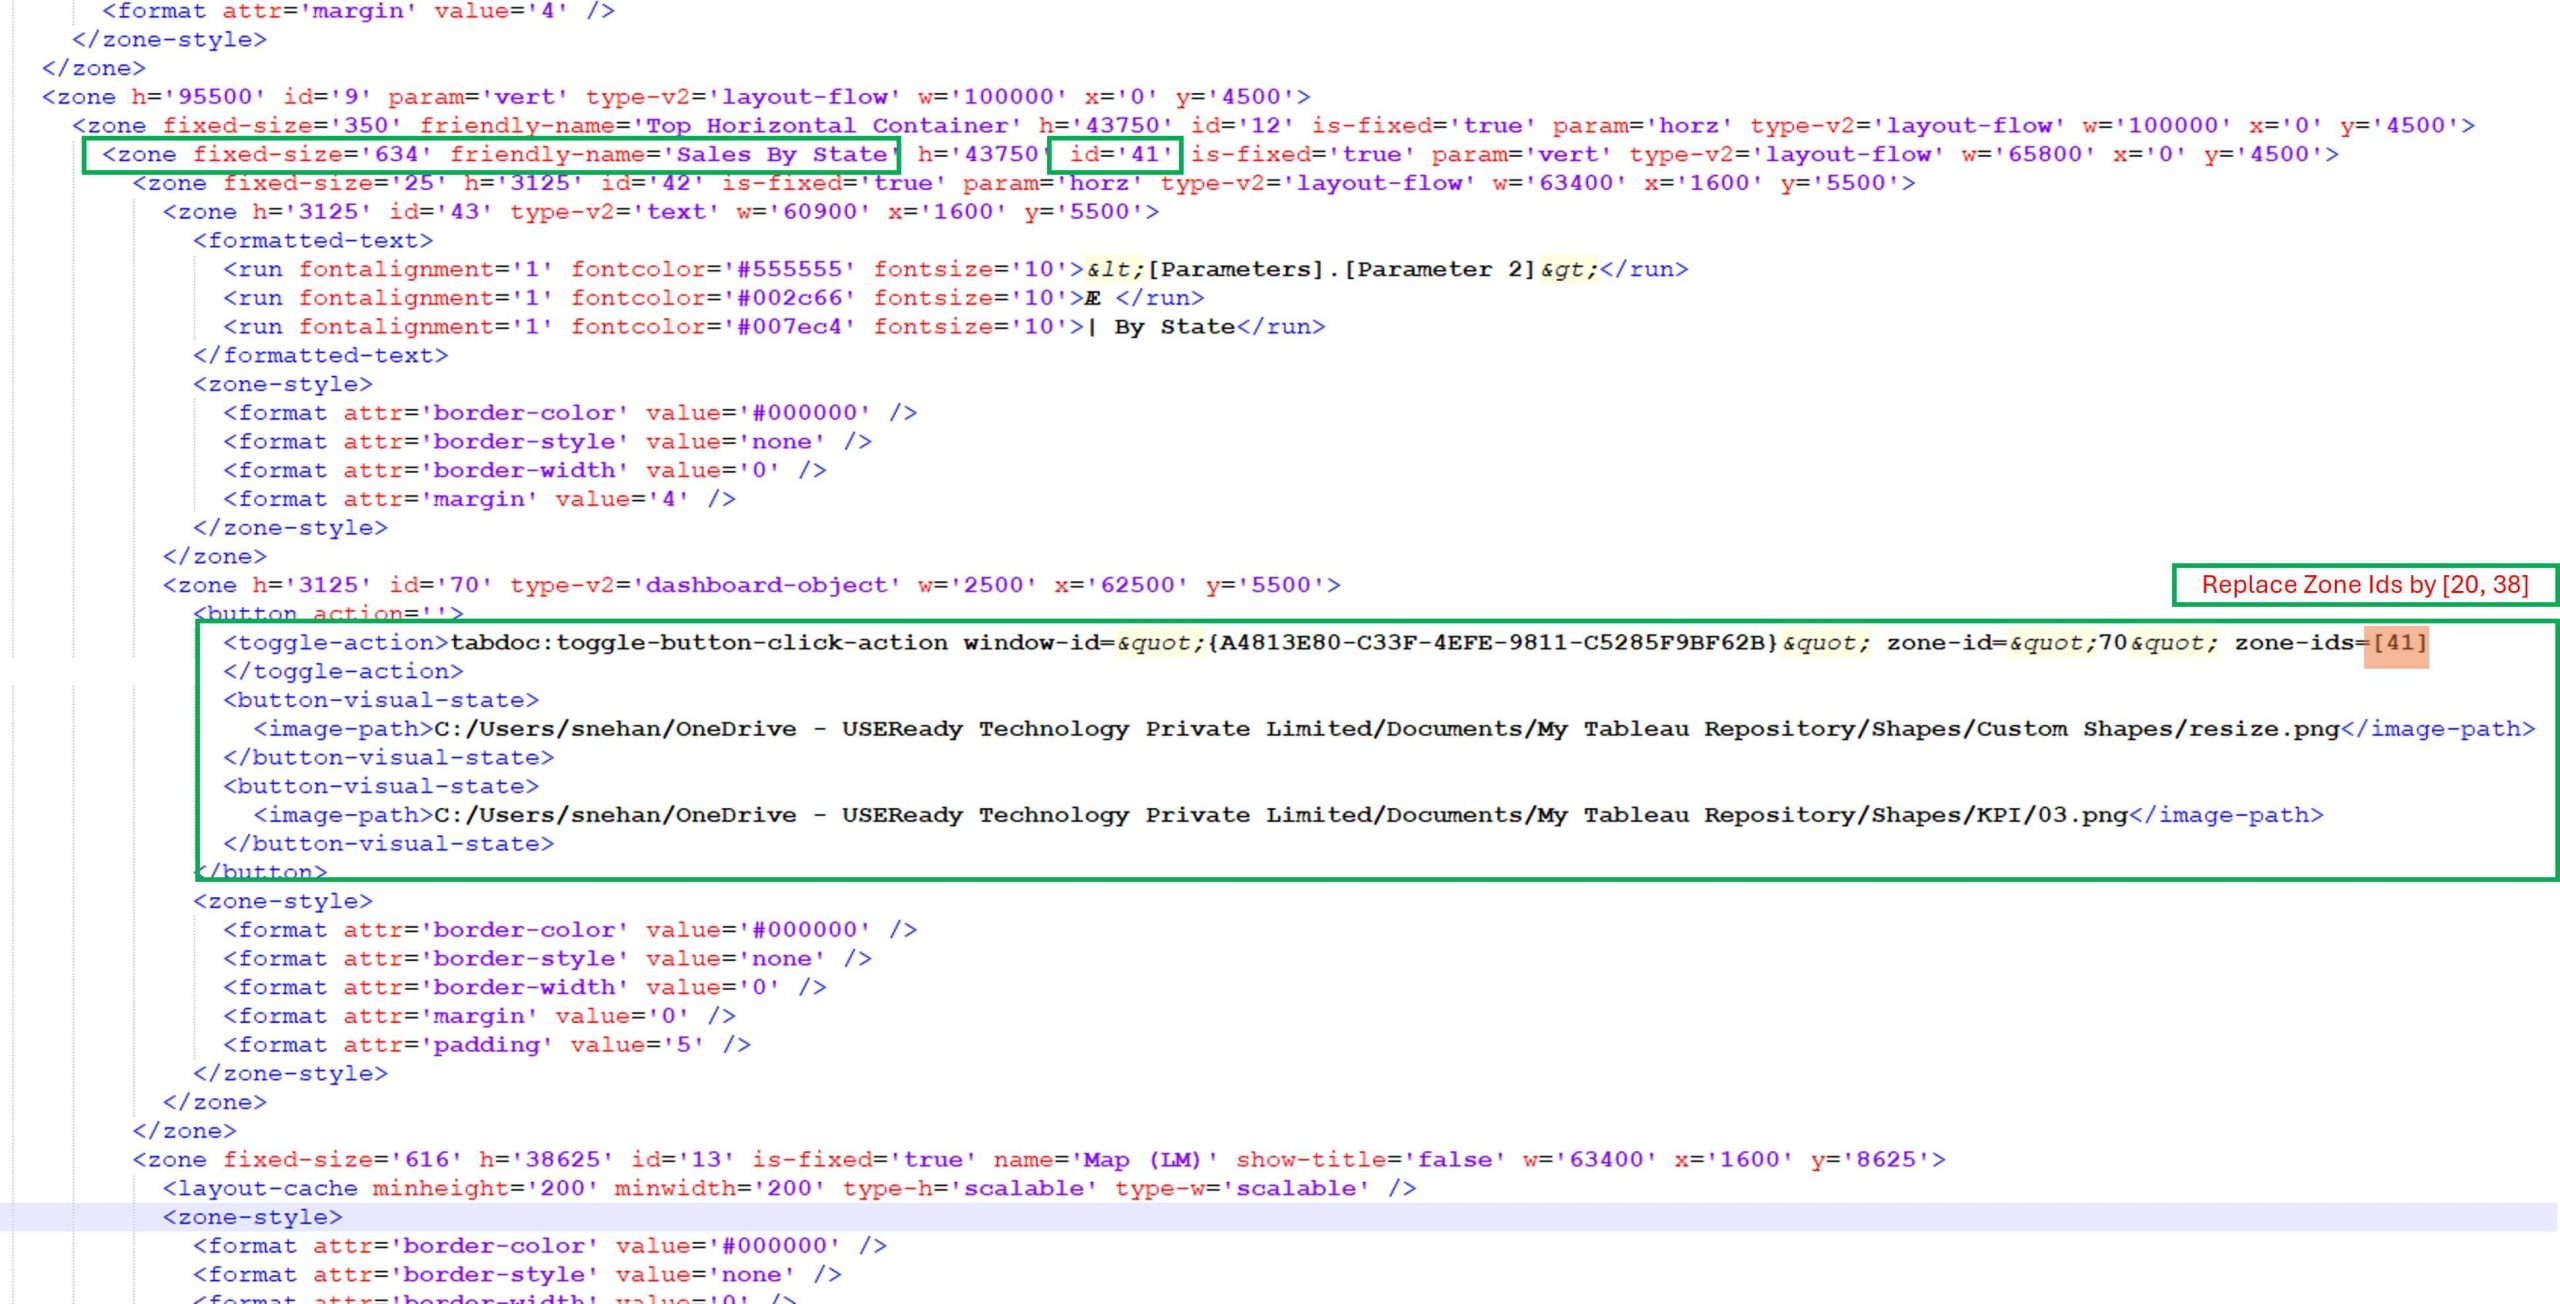
Once the .twb file is opened in Notepad++, search for the zone of the specific container you want to zoom in on. In our example, we’ll search for the zone of the “Sales | By State” container using the container name “Sales By State”. Locate the Show/Hide button we created in this container/zone. We need to replace the zone-ids added in this toggle Button. In our example, when “Sales | By State” is zoomed in, the other parts of the dashboard should hide. So, we’ll add all the zone-ids here that need to be hidden when “Sales | By State” is zoomed in. Here, “Sales | By Region” and the entire horizontal container at the bottom should hide. The corresponding zone-ids for these two containers are 38 and 20. So, we’ll replace the zone ids in the toggle button with [20,38].
Save the file.


Step 5
Testing and Refinement
Open the same .twb file in Tableau Desktop and save it again in .twbx format. Conduct thorough validation to ensure that the zoom in/out functionality is working correctly in your dashboard.
Conclusion
Implementing a Zoom In/Out feature allows us to provide a much cleaner view on the dashboard while still offering detailed information when needed. By following this approach, you can enhance your dashboards with different levels of detail, improving the user experience and making your visualizations more versatile and informative.


