 Media Coverage
 Press Release
Unleashing Ask Data: Transformative Natural Language Querying in Tableau
Harnessing the Power of Conversation: Exploring Ask Data in Tableau
Ask Data: Empowering Data Exploration Through Natural Language Queries
In Version 2019.1, Ask Data feature was introduced in Tableau. Ask Data allows you to ask questions from your data in common language or natural language and the output is given in visualizations/graphs.
Initially, Ask Data was only available in Tableau Server or Tableau Online. But in version 2021.2, it is released in Tableau Desktop as well. This feature allows users to perform visual analytics without knowing any database language like SQL or even Tableau Desktop. It allows you to ask questions naturally with the use of some keywords like “Current Year”, “Last Month”, “Most Popular” etc.
Introducing Ask Data: A Revolutionary Approach to Data Interaction
Understanding Ask Data’s Capabilities: Features and Benefits
Implementing Ask Data: Best Practices for Successful Adoption
Driving Insights with Ask Data: Real-world Examples and Use Cases
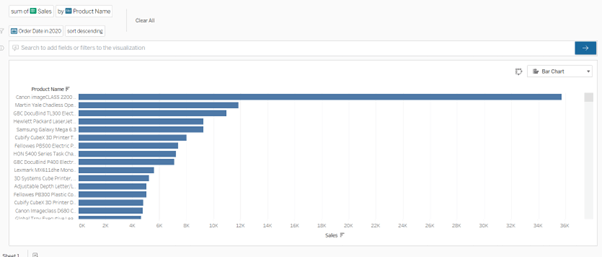
Example of query below.
Most Popular Product Names by Sales in 2020.
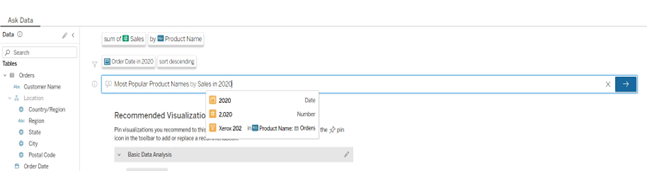
Once you click on Enter, below output will be displayed.
Ask Data feature works only for published data sources. Anyone with a Tableau license – Creators, Explorers and viewers can use Ask Data Feature.
Getting Started with Ask Data: Setup and Configuration Tips
Ask Data in Action: Navigating the Interface and Asking Questions
Maximizing Ask Data’s Potential: Tips for Effective Querying
Leveraging Ask Data for Business Impact: Case Studies and Success Stories
Ask Data is useful for –
Ask Data helps users with little or no Tableau experience but want to explore data, gain insights, and make decisions. For example, the people in higher management can use this feature that are not answered by dashboards in server directly.
It can also be used by employees, where based on situations, they have unique questions. Even technical people can use Ask Data if they want some answers but are not willing to spend time in building dashboard.
How does Ask Data work?
With Ask Data, users can simply type what they are looking for and Tableau provides them the visualization without any need to drag and drop dimensions and measures.
Before you can create any visualization using Ask Data, you will have to create Ask Data Lens.
What is Ask Data Lens?
Ask Data Lens filters or optimizes data for different users.
For instance, in an organization, there will be different data for marketing, sales, HR departments. To optimize data for different kind of users, separate Ask Data Lenses can be created which will query different subsets of data.
How to create Ask Data Lens?
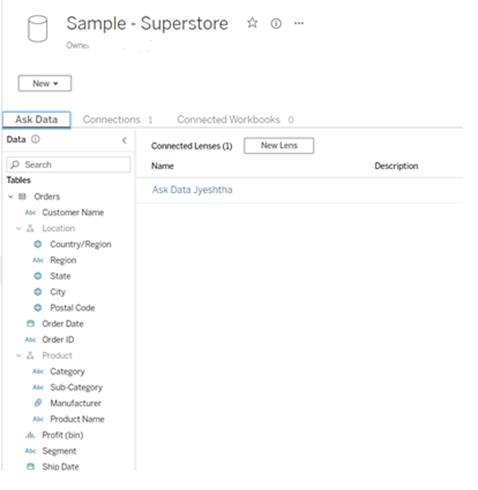
For creating Ask Data Lens, go to published Data source,
- Click on New > Lens using this Data source.
- Enter Name, Description and Location.
- Publish Lens.
The relevant fields in Lens can be selected by clicking on Pencil icon.
Disable or Enable Ask Data Lens
Ask Data is enabled by default and can be disabled by Tableau administrators. Disabled hides Ask Data from the site but preserves information so that it can be restored when enabled again.
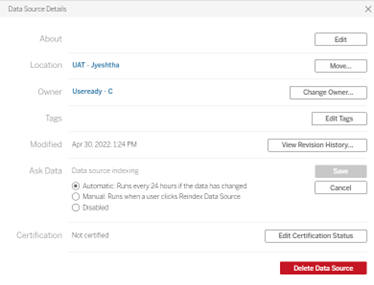
To disable the Ask Data Lens,
- Go to Data Source Page and click on Details icon.
- Click on Edit in Ask Data Section.
- Select Disabled.
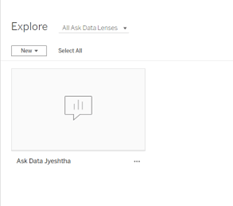
Here are all the places in Tableau where you can use an Ask Data lens:
1). In Tableau Server, in All Ask Data Lenses page.
2). Under the Ask Data tab for the data source.
3). From Ask Data object in Tableau Dashboard.
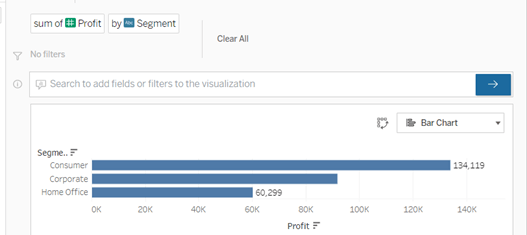
Below is an example of visualization created using Ask Data feature.
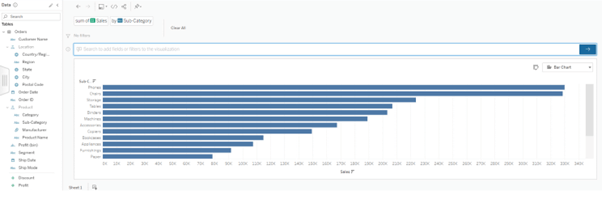
The above visualization displays sum of sales by Sub-Category.
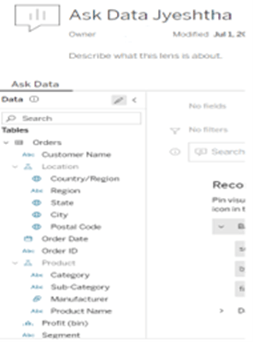
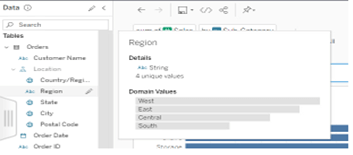
When you hover on to a field in the left pane in Ask Data, you’ll see a summary of the field and some of its metadata, such as:
- Data Type
- Unique Values
- Domain Values
- Preview of calculations (in-case of calculated fields)
Let us see examples below how we can create visualizations in Ask Data.
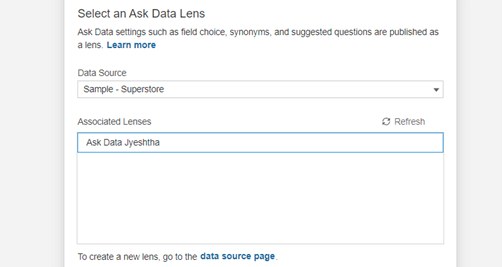
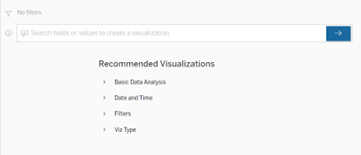
1). Using Recommendations
Under Recommended Visualizations, we get some examples of visualizations that can be created.
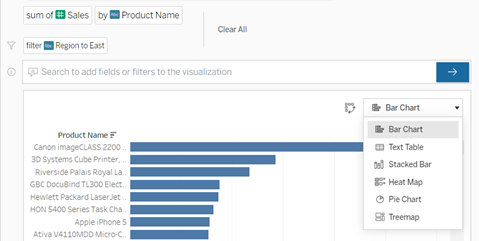
2). By writing questions
Question: What are the sales by Product Name in East Region?
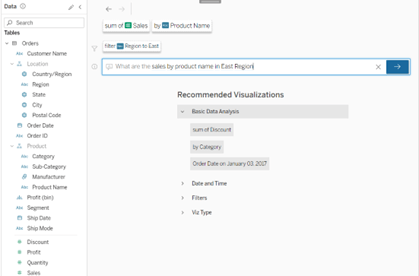
Output
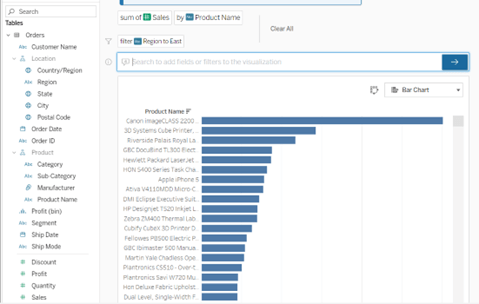
We can also change the chart type as shown below.
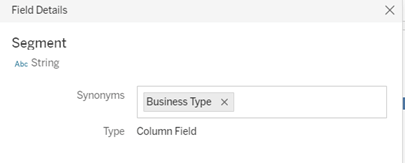
Synonyms can also be created which helps the business users while querying. It helps to interpret natural language questions.

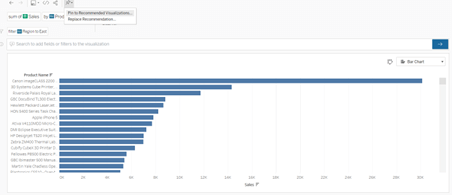
Add or Replace a recommended Visualization
- Enter a query or question and press Enter.
- After the visualization comes up, click on Pin button to either Pin to Recommended Visualizations or Replace Recommendation.
Permissions of Ask Data Lens
The three basic and mandatory requirements to access Ask Data lens:
- Viewer role or above
- Permission to connect Data Source
- View Data Lens
To change or set user permissions, follow below steps:
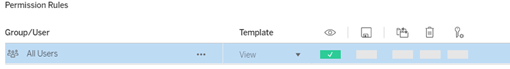
1). Click on three dots in Data Lens and go to Permissions.
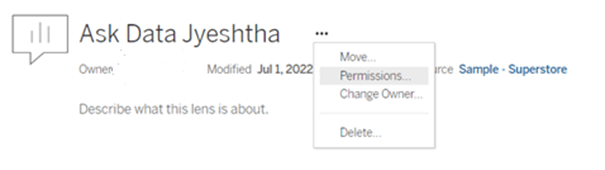
2). Give the permissions for specific users or all users.
Limitations of Tableau Ask Data
- Row level security can be implemented only when it is live connection with user security inbuilt.
- In Ask Data, users don’t have control of Marks card. To use Marks card features like color or size, the graph needs to be saved as a workbook.
- Ask Data can only be used with published data sources.
- Once we save a workbook from Ask Data, no more questions can be asked in that.
As a conclusion, I can say Ask Data is pretty simple. It can help the users with different skill sets to get insights from their data.